
Lysophosphatidic Acid Prevents Ischemia Reperfusion Injury but does not Prevent Tubular Dysfunction
Sabrina R. Gonsalez1, Aline L. Cortes1, Mayara A. Romanelli1, Paula Mattos-Silva2, Andrew C. Curnow3, Minolfa C. Prieto3,4, Marcelo Einicker-Lamas2, Lucienne S. Lara1
1Instituto de Ciências Biomédicas, Universidade Federal do Rio de Janeiro, Rio de Janeiro, Brazil
2Instituto de Biofísica Carlos Chagas Filho, Universidade Federal do Rio de Janeiro, Rio de Janeiro, Brazil
3Department of Physiology, School of Medicine, Tulane University School of Medicine, New Orleans, LA, USA
4Tulane Hypertension and Renal Center of Excellence, Tulane University, New Orleans, LA, USA
Abstract
Lysophosphatidic acid (LPA) protects the kidneys from tissue ischemic reperfusion injury (IRI), but its impact on renal function is primarily limited to glomerular function. We estimated the status of renal function by a complete glomerular and tubular functional analysis to test the hypothesis that LPA treatment during ischemia-reperfusion (I/R) protects renal function by attenuating IRI. Male Wistar rats were subjected to bilateral kidney I/R. Along with ischemia, LPA was administered. LPA increased levels of plasma LPA, downregulated LPA2R, prevented interstitial fibronectin and TGF-β1 accumulation, and prevented a decrease in glomerular filtration rate (GFR). I/R increased urine volume and proteinuria and decreased fractional Na+ excretion (FENa) and urine osmolality. These effects were not prevented by LPA. The reduction in FENa was attributed to disruption in tubular Na+ transport and downregulation of protein kinase C (PKC) activity. LPA treatment maintained (Na++K+)ATPase activity to the control level, due to a sustained sensitivity to PLC/PKC pathway. Na+-ATPase activity was insensitivity to LPA treatment. This ineffectiveness was associated with downregulation of LPA2R, resulting in low FENa. Altogether, LPA treatment maintained normal kidney structure and prevented the reduction of glomerular function. However, even in the setting of preserved GFR, impaired tubular function may present a high risk for silent progression of kidney disease.
Introduction
Acute kidney injury (AKI) is a sudden episode of kidney failure that complicates the course of hospitalizations with high morbidity, mortality, and medical expense1. The injury is characterized by reduction of renal function, specifically glomerular filtration rate (GFR), in a few days or weeks2. A portion of individuals suffering severe AKI require dialysis and are vulnerable to developing an incapacitating chronic kidney disease – leading to end-stage renal disease (ESRD) – increasing risk of kidney transplant1,3.
Renal ischemia/reperfusion (I/R) accounts for 60% of new cases of AKI3. Transient renal ischemia, which may occur from a variety of etiologies, provokes an impairment of oxygen and nutrient supply, waste product accumulation in kidney cells, and subsequent reperfusion endothelial dysfunction4. The consequences are inflammation, mitochondrial dysfunction, oxidative stress, lipid peroxidation, endoplasmic reticulum stress, and activation of the renin angiotensin system (RAS) that affect glomerular structure and epithelial tubular Na+ transport leading to an overall decline in renal function5-8. Moreover, ischemia/reperfusion injury (IRI) accounts for 30% of delayed graft function, or primary nonfunction, after the renal transplantation9,10.
Glycerophospholipids are the most abundant class of lipids in the plasma membrane, playing not only a structural role but also being a source of bioactive lipids involved in different cell signaling cascades. Bioactive lipids assume a critical role in renal function regulation during renal diseases. In vitro studies using renal basolateral membranes from kidney proximal tubular cells showed the involvement of bioactive lipids as regulators of ion membrane transporters, such as Ca2+-ATPase (PMCA)11,12, ouabain-resistant, furosemide sensitive Na+- ATPase13, and oubain-sensitive (Na++K+)-ATPase14,15. Lysophosphatidic acid (LPA) is a bioactive lipid produced in the kidney – since all enzymes necessary for its synthesis are expressed in renal tissue – and it is involved in renal function regulation16. LPA is a hydrophobic molecule that triggers different cell signaling cascades through the activation of different types of metabotropic (G-protein coupled) receptors (LPA2R > LPA3R = LPA1R, in respective affinity for LPA), resulting in different cellular responses, including ion transport16-18. The complete expression and distribution of LPA receptors at a molecular level in specific cell types in the kidney is not well known. Renal cortex shows a relative expression profile of LPA3R > LPA2R >> LPA1R (from highest to lowest)18,19.
Increased LPA levels in the blood are thought to cause abnormal renal tubular epithelial cell architecture by activating apoptotic signaling, recruiting immune cells to the site of injury, and stimulating profibrotic signaling via increased gene transcription20,21. In the mouse model of diabetic nephropathy, LPA1R/ LPA3R antagonism attenuated glomerular sclerosis and the development of tubulointerstitial fibrosis22-24. Although LPAR antagonism might be a therapeutic target to prevent chronic kidney disease, the effects of LPA/LPAR signaling on renal function in the IRI model are still unclear. Geng et al.25 proposed that endogenous LPA initiates autocrine signaling during I/R that activates a paracrine profibrotic signaling in injured kidney tubule cells through LPA2R. Exogenous administration of LPA or analogues showed that low doses of LPA (0.01 and 0.1 mg/kg) protect the kidney from IRI by LPA2R activation, while higher doses (1 mg/kg) activate LPA3R, thus promoting renal damage18. In contrast, intraperitoneal administration of LPA at low doses immediately after ischemia attenuates IRI in mice by inhibition of caspase-dependent apoptosis in tubular cells, and reduces complement activation and neutrophil recruitment. This event occurs even at higher doses26.
Although earlier studies have proposed that LPA administration prevents increases in plasma creatinine and blood urea nitrogen during renal IRI18,26,27, it has not been shown that this is mediated by an association between LPA and tubular Na+ transport and function.
In the present study, we used Wistar rats to test the hypothesis that attenuation of IRI by LPA treatment during I/R protects overall renal function. We utilized a complete functional kidney study which included glomerular and tubular functions. The present study demonstrated a mechanism by which LPA treatment prevents IRI and preserves glomerular function, without alteration of proteinuria or urinary electrolyte and water excretion. The lack of an effect of LPA on tubular function may be a key factor that leads to the development of chronic kidney disease.
Materials and Methods
Experimental Animal
The protocol to use experimental animals was in accordance and approved by the Federal University of Rio de Janeiro Institutional Animal Care and Use Committee (protocol number 137/13). Wistar rats were purchased from Centro de Criação de Animais de Laboratório (CECAL, Fiocruz, Rio de Janeiro, Brazil). The rats were maintained during the period of study at the vivarium, fed with regular chow and ad libitum water, and kept at a constant temperature (23±2ºC) with standard dark/light cycles (12/12 h). Forty-five rats were randomly divided into 3 groups (15 rats/group): control (CTRL), I/R, and LPA treated (I/R+LPA). The “n” number used in each experiment is described in the respective Table and Figure.
Ischemia-reperfusion procedure and sample collections
Male Wistar rats (180-250 g BW) were randomly divided in 3 groups: sham-operated rats (CTRL; n=15), ischemia-reperfusion group (I/R; n=15), and LPA-treated group (I/R+LPA, n=15). The renal I/R procedure was performed as previously described28. Briefly, a non-traumatic vascular clamp was applied to the both renal pedicles for 30 min followed by 24 h of reperfusion. In the I/R+LPA, LPA [1mg/kg 1-Oleoyl-sn-glycerol 3-phosphate sodium salt, 3-sn- Lysophosphatidic acid, 1-oleoyl sodium salt, LPA sodium salt (Cat number L7260, Sigma) in vehicle: 3% Bovine Serum Albumin (BSA) dissolved in Phosphate buffered saline (PBS)] was administrated by subcapsular injection (150 μl per 250 g of body weight, half of volume to each kidney) immediately after applying the vascular clamps. The CTRL group received the vehicle described above by subcapsular injection. All groups, during the 24 h of reperfusion period, were placed in metabolic cages for urine collection. Blood and kidney samples were collected at the end of reperfusion period after euthanasia. Blood samples collected in glass tubes containing EDTA (5 mM) were centrifuged (3,000 g for 10 min) to separate the plasma fraction for measurement of blood urea nitrogen (BUN), Na+, and creatinine. Urine samples were also centrifuged for 5 min to exclude sediments prior to proteinuria, Na+, and creatinine analysis. Immediately after kidney harvesting, the poles were placed in paraformaldehyde (4%) for histological and immunofluorescence studies28, and the sections from renal cortex were used for protein quantification and enzymatic assays.
Renal function parameters
The renal function parameters: filtered load of Na+ (FLNa), Na+ excretion (ENa), fractional Na+ excretion (FENa), urine osmolality, GFR, blood urea nitrogen, and proteinuria were calculated as previously described by Cortes et al28. GFR was calculated from the clearance of endogenous creatinine: Clcr = Ucr × V/Pcr, where V is the urinary volume (in ml/24 h), and Ucr and Pcr are the urinary and plasma creatinine concentrations, respectively (in mg/dl).
Preparation of kidney homogenates
Renal cortices were dissected in cold buffer containing sucrose (250 mM), HEPES-Tris (10 mM), EDTA (2 mM), trypsin inhibitor (0.15 mg/mL), and phenylmethylsulfonyl fluoride (1mM), at pH 7.4. Homogenate preparation of kidney cortex samples were obtained as described previously29. Total protein concentration was assayed according to Lowry et al.30, using bovine serum albumin (BSA) as standard. Samples were maintained at −20°C until use.
Western blotting analysis
Eighty micrograms of protein from kidney cortex homogenates were separated by electrophoresis in polyacrylamide gel (SDS PAGE 10%) and transferred to a nitrocellulose membrane (GE Healthcare, Life Sciences, Freiburg, Germany). Membranes were blocked 1 h with 5% of milk before antibody incubation. The antibodies used to detect LPA receptors were: rabbit polyclonal anti LPA1R (EDG-2, ab23698, Abcam), LPA2R (EDG-4/H-55, sc-25490, Santa Cruz Biotechnology) and LPA3R (EDG-7/H-60, Sc-25492, Santa Cruz Biotechnology, CA). A specific antibody to detect (Na++K+)ATPase was used [(Na++K+) ATPase α1 (9-A5) sc-58629, Santa Cruz Biotechnology]. After successive washes, the membranes were incubated with either a donkey anti-rabbit or anti-mouse secondary fluorescence antibody [IgG IRDye 800 CW (Li-cor Biosciences, Lincoln, NE)]. Densitometric analysis was done by normalization against the β-actin band (Sigma A5441). The immunofluorescence was detected using the Odyssey System (Li-Cor Bioscience, Lincoln, NE) for infrared image recording of band intensities to quantify using the Image J software (National Institutes of Health, Bethesda, MD).
LPA measurement
Plasma LPA concentration was measured in plasma of all groups using the LPA kit II from Echelon Biosciences Inc. (UT, USA), following the manufacture instructions.
Measurement of primary sodium transporters
The ouabain-sensitive (Na++K+)ATPase and the ouabain-resistant, furosemide sensitive Na+-ATPase activities were measured as described by Queiroz-Madeira et al29. To investigate the possible involvement of the phospholipase C (PLC) pathway in modulating the (Na++K+)ATPase and Na+-ATPase activities in kidneys from I/R and LPA treated rats, both the ATPase activities were measured in the absence and presence of U73122 (5 x 10⁻⁸ M), a selective inhibitor of PLC. The protein samples were pre-incubated with the inhibitor for 10 min before the ATPase activity assay.
Calphostin C-200 sensitive PKC activity
The PKC activity was measured according to prior protocols by Cabral et al31. Activity was measured by incorporation of the γ-phosphoryl group of (γ-32P)ATP into histone in the absence and presence of calphostin C (10 nM) (Calbiochem, CA, USA), a PKC inhibitor. The radioactivity was quantified in a liquid scintillation counter (Tri-Carb, Packard).
Histology and immunofluorescence in kidney sections
Kidney pole sections (4 μm), paraffin embedded, were stained with Periodic Acid Schiff (PAS) and Haematoxylin Eosin (HE) as described28,32. The sections were analyzed by one of the co-authors (L.S.L.) in a blind manner. From each mouse kidney section (n=3), an average of 20 microphotographs were captured at 20x magnification using a digital camera attached to a Nikon Eclipse-50i microscope. All adjustments (exposure time and gain) were consistent. Renal injury was scored using the periodic acid-Schiff (PAS)-stained sections. Tubular injury was defined as tubular dilation, tubular atrophy, tubular cast formation, sloughing of tubular epithelial cells or loss of the brush border, and thickening of the tubular basement membrane using the following scoring system: Score 0: no tubular injury; Score 1: <10% of tubules injured; Score 2: 10–25% of tubules injured; Score 3: 25–50% of tubules injured; Score 4: 50–74% of tubules injured; Score 5: >75% of tubules injured28,33.
For immunofluorescence, the kidney sections were processed by an immunoperoxidase technique as previously described28,34,35, and incubated with the anti-rabbit fibronectin (sc-146; Santa Cruz Biotechonology, Santa Cruz, CA), anti-rabbit TGF-β1 (ab2413; Abcam, Cambridge, UK), and anti-(Na++K+)ATPase subunit α1 (sc58629; Santa Cruz Biotechonology, Santa Cruz, 225 CA) overnight at 4°C, followed by successive washes and 1 h of incubation at 22°C with the secondary antibody (Alexa Fluor 488-Labeled; Invitrogen, Carlsbad, CA). Negative controls were performed by omission of the primary antibody.
Statistical Analysis
For statistical tests and graphs, the GraphPad Prism 6.0 software (GraphPad Inc., La Jolla, CA) was used. The data are presented as the mean ± SEM. Multiple comparisons were made by one-way analysis of variance (ANOVA) followed by Tukey’s multiple comparison test.
Results
LPA treatment ameliorates renal glomerular function
To investigate whether LPA treatment preserves renal function during an I/R procedure, we subjected the rats to a subcapsular LPA injection (1 mg/Kg) immediately after renal peduncle occlusion. Table 1 presents the renal physiological parameters of the CTRL, I/R, and LPA+I/R rats. Body weight and water intake did not vary under any of the experimental conditions. Urine volume was ~ 40% higher than CTRL in both I/R and LPA treated rats (P<0.05). LPA treatment maintained the GFR and BUN close to CTRL values. However, LPA treatment did not prevent the increase in proteinuria and the reduction of urine osmolality provoked by renal I/R. The physiological parameters indicate that the I/R rats developed isosthenuria that is not prevented by LPA treatment.
Table I. The impact of LPA treatment on water intake and renal physiological parameters
|
|
CTRL (n=10) |
I/R (n=10) |
I/R+LPA (n=10) |
|
Body Weight |
203.5±10.9a |
222.5±13.0a |
194.6±10.3a |
|
(g) |
|
|
|
|
Water Intake |
13.0±1.3a |
11.0±1.0a |
13.0±2.2a |
|
(mL/24h) |
|
|
|
|
Urine Volume |
4.0±0.2a |
5.8±0.7b |
5.3±0.5b |
|
(mL/24h) |
|
|
|
|
GFR |
594.1±69a |
220±33.9b |
522±58.3a |
|
(μL/min) |
|
|
|
|
BUN |
36.4±1.8a |
80.4±8.8b |
50.0±2.5a |
|
(mg/dL) |
|
|
|
|
Proteinuria |
3.4±0.5a |
8.1±0.5b |
7.8±1.4b |
|
(mg/24h) |
|
|
|
|
Osm urine |
1329±0.12a |
606±0.1b |
878±0.13b |
|
(mOsm/kg) |
|
|
|
Rats were subjected either to bilateral ischemia for 30 min followed by 24 h reperfusion (I/R) or to sham surgery. During ischemia, 1 mg/Kg lysophosphatidic acid (LPA) was administered subcapsular to the I/R rats. Urine and plasma collections were taken at the end of the 24 h reperfusion, corresponding to those in which renal function parameters were measured. Values are means ± SEM. Different superscripted lower-case letters indicate statistically differences (P< 0.05; one-way ANOVA followed by Tukey’s post-test).
Twenty-four hours after the I/R episode, plasma LPA levels decreased by approximately 30% (Fig. 1).
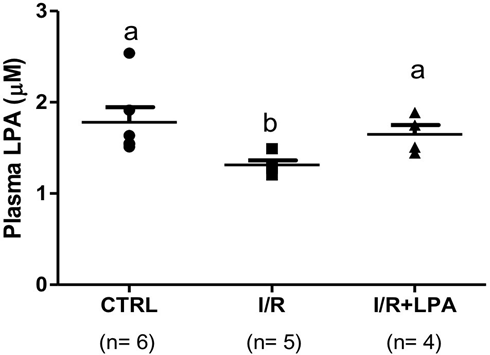
Figure 1: Ischemia/reperfusion episode decreases plasma LPA levels. Rats were subjected to either bilateral ischemia for 30 min followed by 24 h reperfusion (I/R), or to sham surgery (CTRL). Immediately after the ischemic insult, 1 mg/Kg LPA was administered by subcapsular injection (I/R+LPA). Values are means ± SEM. Different lower-case letters above the bars indicate statistically significant differences (P < 0.05; one-way ANOVA followed by Tukey’s post-test.
Subcapsular LPA treatment replenished circulating LPA levels similar to CTRL group. I/R insult did not change the protein content of the three LPA receptors (LPA1R, LPA2R and LPA3R) in the renal cortex (Fig. 2). However, LPA treatment led to a significant decrease in the LPA2R protein content (33%, Fig. 2b).
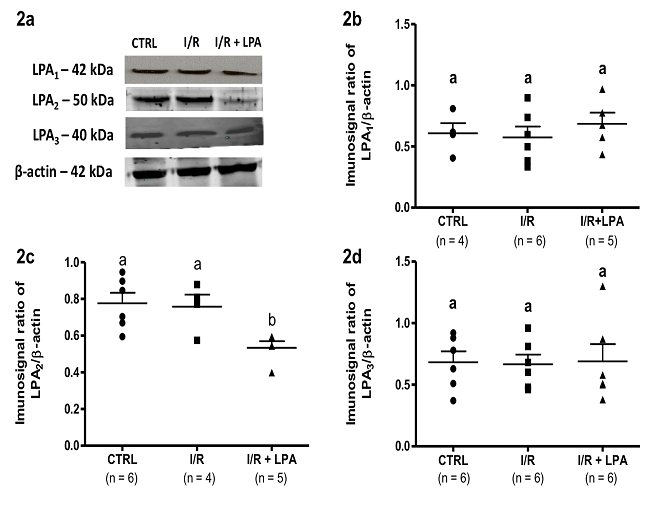
Figure 2: LPA2 receptor content is decreased in the I/R kidney cortex after LPA treatment. Rats were subjected to either bilateral ischemia for 30 min followed by 24 h reperfusion (I/R), or to sham surgery (CTRL). Immediately after the ischemic insult, 1 mg/Kg LPA was administered by subscapular injection (I/R+LPA). (A) Representative images of LPA receptor detection by Western blot. (B) Quantification of the immune band related to the LPA1 receptor (LPA1R) normalized to the β-actin content. (C) Quantification of the immune band related to the LPA2 (LPA2R) receptor normalized to the β-actin content. (D) Quantification of the immune band related to the LPA3 receptor (LPA3R) normalized to the β-actin content. Values are means ± SEM. Different lower-case letters above the bars indicate statistically significant differences (P < 0.05; one-way ANOVA followed by Tukey’s post-test).
Effect of LPA treatment on renal histopathology and fibrosis after I/R
Figure 3 shows representative cortical images of PAS (Fig. 3a-c) and HE (Fig. 3d-f) staining. In the CTRL group, PAS staining (Fig. 3a) revealed the basolateral membranes stained as a continuous line in purple. In the apical pole, the positive PAS reaction is exclusively due to the presence 306 of the glycocalyx (stained in dark purple). Because of the abundance of microvilli at the luminal proximal tubule (PT) cells, the PAS reaction is more intense, being almost nonexistent at the luminal membrane of distal tubule (TD) cells (Fig. 3a). In the cortex from the I/R rat (Fig. 3b) dilatation of the tubules (black stars), cast formation (black triangles), and detachment of the tubular epithelium was detected, and were prevented in the LPA-treated I/R rats (Fig. 3c). Expansion of mesangial cells observed in the I/R rat (compare inset to Fig. 3b with Fig. 3a) was detected in the LPA treated group in lesser extent (Fig. 3c). In this group, the basolateral membranes and the apical membrane from the PT are markedly stained in purple, preserving the structure observed in CTRL group.
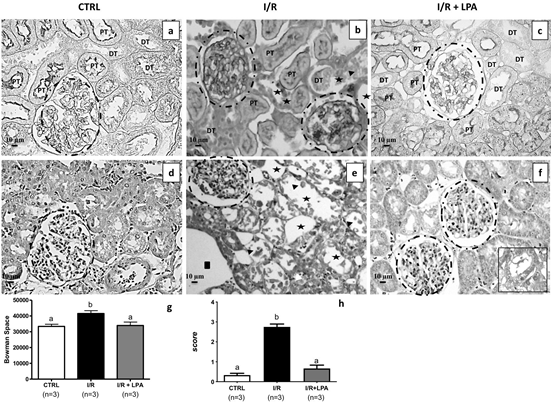
Figure 3: Subcapsular treatment with LPA (1 mg/Kg) attenuates the injury provoked by I/R. Staining was performed as described in the Materials and Methods section. Representative photomicrographs (×400, n=3) of PAS staining (upper panels) and HE staining (lower panels) of kidney cortex are shown. (a and d) CTRL; (b and e) I/R and (c and f) I/R+LPA. The glomeruli are marked by circles. The arrow heads in the I/R image highlight the detached necrotic tubular cells and granular casts with necrotic cellular debris, denuded basement membrane, tubular dilatation, and flattened tubular epithelium; stars represent tubular dilatation and squares represent space between the tubules. PT = Proximal tubule and DT = Distal tubule. Inset to Figure f: the presence of necrotic cell debris in some tubules. (g) Bowman’s space was calculated by the difference of glomerular corpuscle and the respective capillary tuffs diameters, in at least 12 glomeruli per rat kidney (×400; n=3 for each group). (h) Tubular injury score quantified in the HE stained slides (×400; n=3 for each group). Values are means ± SEM. Different lower-case letters above the bars indicate statistically significant differences (P < 0.05; one-way ANOVA followed by Tukey’s post-test).
The Fig. 3e shows kidney sections from I/R rat with stained with HE: congestive glomerular capillaries tufts (compare the glomeruli marked in dash circles of CTRL and I/R rats), dilatation of the tubules (black stars), space between the tubules (black squares), detached necrotic tubular cells and denuded basement membrane, loss of apical membrane, and congestion of peritubular capillaries with grouping of red blood cells (black triangles). These alterations were not observed in the LPA-treated I/R rats, which were similar to the images from CTRL group (compare Fig. 3f with Fig. 3d). We also observed isolated areas with tubular granular protein casts and granular casts with necrotic cell debris (inset to Fig. 3f). No difference in the number of glomeruli between experimental groups were noted, despite variation in size. The Bowman’s space, measured by the difference between the diameter of the renal corpuscle and capillary tuffs (Fig. 3g), was augmented (24 %). LPA treatment maintains Bowman’s space similar to CTRL. The kidney damage quantified in the HE stained slides revealed scores of 2.75 ± 0.14 in the I/R; however, there was no significant difference between I/R+LPA and CTRL (Fig. 3h).
The destruction of renal tubular epithelial cells caused by I/R secondarily causes interstitial fibrosis of the renal parenchyma and rapidly reduces renal function36. Fibronectin deposition and TGF-b1 were analyzed to determine whether LPA treatment had any effect on the development and progression of fibrosis during IRI. I/R provokes fibronectin deposition in the interstitial space around the tubules (Fig.4b) and the glomeruli in the kidney cortex sections (Fig. 4e) compared to CTRL group (Fig. 4a-d). With LPA treatment, no deposition of fibronectin was observed on tubules and a faint staining was observed in the glomeruli (Fig. 4c and Fig. 4f).
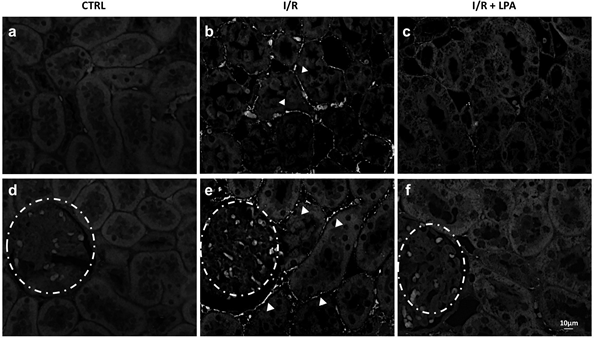
Figure 4: Subcapsular treatment with LPA (1 mg/Kg) prevents fibronectin deposition in the I/R rat. Immunofluorescence was performed as described in Materials and Methods section. Representative digital images of fibronectin deposition in kidney poles from CTRL, I/R, and I/R+LPA tubulointerstitial areas (×400; n=3; upper panels) and glomeruli (×400; n=3; lower panels) were taken. (a and d) CTRL; (b and e) I/R and (c and f) I/R+LPA. Arrow heads demonstrate fibronectin deposition. Glomeruli are shown in dashed circles.
In the CTRL group, TGF-b1 was detected in some interstitial cells close to the tubules and in glomeruli (Fig. 5a: positive interstitial cells were marked with arrow heads and Fig. 5d, respectively). I/R increased TGF-b1 expression in the interstitial cells, around the renal tubules by 3 times (Fig. 5b: arrow heads and Fig. 5h) and in the glomeruli the expression is similar to control (Fig. 5e and Fig. 5g). In the LPA-treated I/R rats, TGF-b1 was not detected in either glomeruli or in the tubule-interstitial areas (Fig.5c, Fig. 5f, Fig. 5g and Fig. 5h).
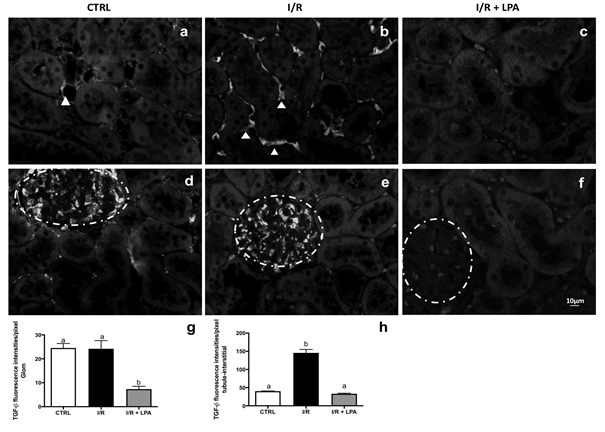
Figure 5: Subcapsular treatment with LPA (1 mg/378 Kg) prevents TGF-β1 expression in the I/R rat. Immunofluorescence was performed as described in Materials and Methods section. Representative photomicrographs of kidney pole TGF-β1 staining at tubulointerstitial areas (×400; n=3; upper panels) and glomeruli (×400; n=3; lower panels). a and d: CTRL; b and e: I/R and c and f: I/R+LPA. Arrow heads demonstrate TGF-β1 expression. Glomeruli are shown in dashed circles. Quantification of TGF-β1 immunofluorescence in the glomeruli (g) and in the tubule-interstitial areas (h) are shown. Values are expressed in fluorescent intensity/pixel (means ± SEM). Different lower-case letters above the bars indicate statistically significant differences (P < 0.05; one-way ANOVA followed by Tukey’s post-test).
Effect of LPA treatment on tubular Na+ handling: the influence on the active Na+ transporters
The main function of the renal tubules is the regulation of Na+ and water reabsorption downstream from the ultrafiltration mechanism in the glomerulus. Because the plasma Na+ concentration was unchanged under any conditions ([Na+]p, mEq/L), the filtered load of Na+ (FLNa) was dependent on the GFR (Table 2). As observed in the GFR, FLNa was decreased in the I/R rat. LPA treatment maintained FLNa levels close to CTRL. Likewise, I/R decreased renal sodium excretion (ENa) and fractional Na+ excretion (FENa) by 75% and 65%, respectively, while the LPA treatment prevented the decreases in FLNa, but not ENa or FENa (Table 2).
Table II. The impact of LPA treatment on renal Na+ excretion.
|
[Na+] plasma |
142±6.0a |
141±5.3a |
140±2.8a |
|
(mEq/L) |
|
|
|
|
ENa |
0.23±0.017a |
0.06±0.014b |
0.11±0.023b |
|
(mEq/L) |
|
|
|
|
FENa |
0.79±0.13a |
0.27±0.09b |
0.35±0.06b |
|
(%) |
|
|
|
|
FLNa |
34±6.3a |
14.7±2.1b |
38.6±4.9a |
|
(μmol/min) |
|
|
|
Rats were subjected to bilateral ischemia for 30 min followed by 24 h reperfusion (I/R) or to sham surgery. During ischemia, 1 mg/Kg lysophosphatidic acid (LPA) was administered intracapsular to the I/R rats. Urine and plasma samples were taken at the end of the 24 h reperfusion, corresponding to those in which renal function parameters were measured. Values are means ± SEM. Different superscripted lower-case letters indicate statistically significant differences (P< 0.05; one-way ANOVA followed by Tukey’s post-test).
Reabsorption of FLNa in renal tubule cells is dependent on the electrochemical gradient generated by the Na+ active transporters: the (Na++K+)ATPase and the ouabain-resistant, furosemide-sensitive Na+-ATPase located along the basolateral membranes of the epithelial cells. In the kidney cortex, the I/R increased the (Na++K+)ATPase activity by 220% (in nmol Pi.mg-1.min-1: CTRL = 48.0 ± 4.6; I/R = 108.0 ± 19.0, n = 5, P<0.05) (Fig. 6a) in parallel with a 45% increase in the protein content (Fig. 6b). The Na+-ATPase activity decreased by 70% (in nmol Pi.mg-1.min-1: CTRL = 23.0 ± 3.0; I/R = 7.8 ± 1.9, n = 5, P<0.05), (Fig. 6c). LPA treatment exclusively prevented the alterations of the (Na++K+)ATPase activity (Fig. 6a and 6b).
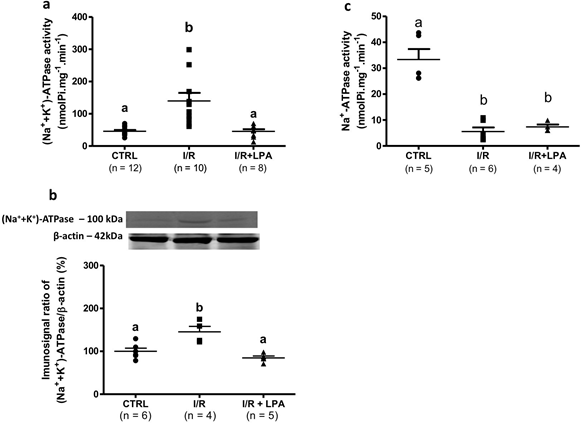
Figure 6: Subcapsular treatment with LPA (1 mg/Kg) exclusively prevents the increase of cortical (Na++K+)ATPase activity and protein content in the I/R rat. ATPase activity was measured in the homogenate obtained from kidney cortices. (a) Ouabain-sensitive (Na++K+)ATPase activity and (b) protein content (% of control), respectively. (c) Ouabain-resistant, furosemide sensitive Na+- ATPase. Values are expressed as nmol Pi.mg-1.min-1. Different lower-case letters above the bars indicate statistically significant differences 428 (P < 0.05; one-way ANOVA followed by Tukey’s post-test).
Moreover, (Na++K+)ATPase immunolocalization detected the enzyme in the luminal membranes of tubular cells in the I/R rats, which was not observed with LPA treatment (Fig. 7).
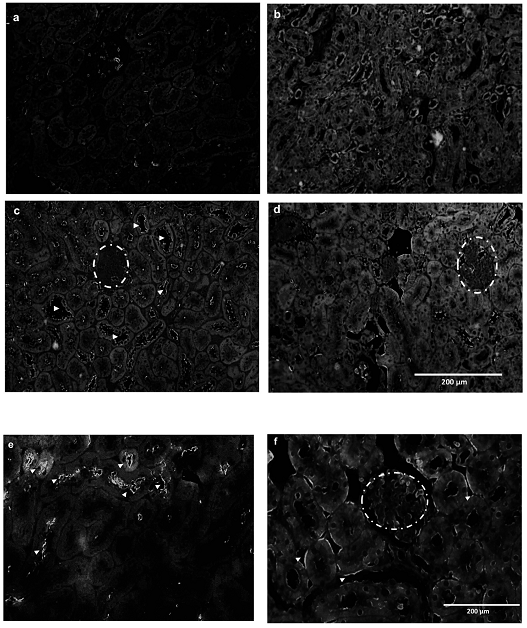
Figure 7:Subcapsular treatment with LPA (1 mg/Kg) maintains immunolocalization of the (Na++K+)ATPase on basolateral membranes of the cortical tubules. Immunofluorescence was performed as described in Methods section. Representative photomicrographs of (Na++K+)ATPase staining in kidney poles: (a) negative control, (b) CTRL, (c) I/R and (d) I/R+LPA lower magnification (×200; n=3) and (e) I/R and (f) I/R+LPA higher magnification (×400; n=3). Arrow heads demonstrate (Na++K+)ATPase localization. Glomeruli are shown in dashed circles.
LPA receptors expressed in the kidney (LPA1R, LPA2R and LPA3R) are coupled to a great variety of G proteins subsets that activate cell signaling cascades. Both the Gαq/11 sub-unit and the βγ sub-unit from Gi/o, dissociated from the trimeric conformation, modulate the PLC/PKC signaling pathway that is known to regulate the Na+ transporters15,31,36. We measured PKC activity in the renal cortex of all experimental groups. Twenty-four hours after the I/R episode, we detected a 50% decrease in calphostin C sensitive-PKC activity. LPA treatment maintained the calphostin C sensitive-PKC activity similar to control values (in nmol Pi/mg-1.min-1, CTRL: 2.2±0.3; I/R:1.16±0.2 and LPA: 1.77±0.3) (Fig. 8).
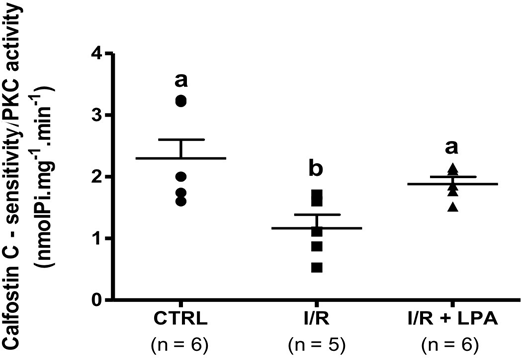
Figure 8: Subcapsular treatment with LPA (1 mg/Kg) prevents the decrease in calphostin C-sensitive protein kinase C (PKC) activity in the I/R rat. PKC activity was measured in the homogenate obtained from kidney cortices. The enzyme activity was calculated by incorporation of the γ-phosphoryl group of (γ- 32P)ATP into histone in the absence and presence of calphostin C (10 nM), a PKC inhibitor. Values are means ± SEM. Different lower-case letters above the bars indicate statistically significant differences (P < 0.05; one-way ANOVA followed by Tukey’s post-test).
To investigate whether, in this model of IRI, the Na+ transporters are target proteins for the LPA-dependent PLC/PKC pathway we measured the (Na++K+)-ATPase and Na+-ATPase activities in the presence and absence of the PLC inhibitor, U73122. The results presented in Fig. 9a and Fig. 9b were obtained by measuring the difference in activity between the absence and presence of U73122. In CTRL rats, the (Na++K+)-ATPase activity in the absence of U73122 was 44±5,3 nmol Pi/mg-1.min-1 and in the presence of the PLC inhibitor was 22±3,7 nmol Pi/mg-1.min-1. In this setting, 50% of the (Na++K+)ATPase activity is sensitive to U73122 (Fig. 9a). In the I/R group, the enzyme sensitivity was about 10%. LPA treatment maintained the sensitivity of (Na++K+)ATPase to U73122 similar to CTRL (Fig. 9a). The Na+-ATPase in CTRL group had the same profile as (Na++K+)ATPase, with the activity being 35±7.6 nmol Pi/mg-1.min-1 in the absence of U73122 and 13.6±3.8 nmol Pi/mg-1.min-1 in the presence of the PLC inhibitor, such that approximately 40% of (Na++K+)ATPase is sensitive to PLC (Fig. 9b). However, the Na+-ATPase activities from both I/R and I/R+LPA rats were insensitive to U73122 (Fig. 9b).
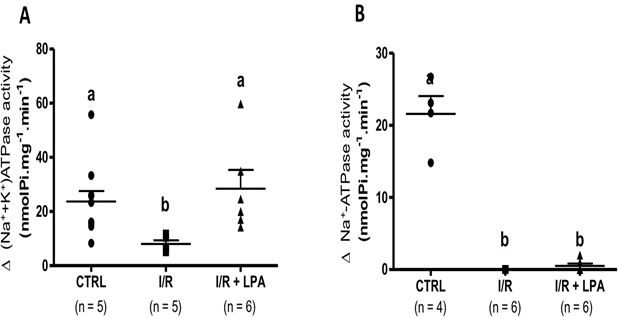
Figure 9: The maintenance of the cortical (Na++K+)ATPase activity mediated by subcapsular treatment with LPA (1 mg/Kg) is dependent on the PLC/PKC pathway. (Na++K+)-ATPase (a) and Na+-ATPase (b) activities were measured in the presence and absence of the PLC inhibitor, U73122. The results were expressed by the difference of the ATPase activity in the absence and in the presence of U73122 (Δ of the ATPase activity). Values are means ± SEM. Different lower-case letters above the bars indicate statistically significant differences (P < 0.05; one-way ANOVA followed by Tukey’s post-test).
Discussion
In the present study we reported a complete analysis of the impact of LPA (1 mg/Kg) simultaneously administered during induction of I/R on renal function. The single dose of 1 mg/Kg was chosen based on the study by Vries et al.26 that administered multiple doses of LPA in a rat renal I/R model. The authors showed that higher doses of LPA (2 mg/Kg) administrated during the procedure of ischemia-reperfusion (I/R) had no additional protective effects on renal function in comparison to 1 mg/Kg. At this dose, LPA prevented accumulation of blood urea nitrogen, apoptosis, and evidence of inflammation. Lowest doses of LPA (0.01 and 0.1 mg) were not effective. We demonstrated that LPA treatment prevented the reduction in glomerular function (as proposed by others37) but did not affect the increase in urine volume, proteinuria, and diminished FENa observed after a 24 h-I/R episode. Those parameters were related to a tubular disruption that was not prevented by LPA treatment. This observation is relevant since it may cause a silent progression to chronic kidney disease.
We used the IRI model to induce a bilateral transient ischemic episode by clamping the kidney pedicle, followed by 24 h reperfusion. In the first 24 h of reperfusion, we detected reduced GFR, and consequently increased BUN, polyuria, and isosthenuria associated with diminished FENa and proteinuria. In this report, we demonstrated that tissue morphometry of kidney I/R rat is consistent with a mild to severe IRI (score 2.75 ± 0.14). Interstitial fibronectin accumulation and augmented tubular TGF-β1 expression were also detected. Our experimental model presented the same characteristics previously described28,38-44.
The subcapsular treatment with LPA (1 mg/Kg) administered during induction of I/R prevented tissue remodeling, as histological analysis demonstrated similar tissue architecture compared to control. These observations are similar to those found with intraperitoneal LPA administration26. One limitation of this work is that we were not able to exclude if the effects observed in the I/R+LPA are due to less systemic inflammation or if there is less inflammation because the kidneys were treated with LPA. Indeed, intrarenal LPA treatment provokes LPA replenishment in the blood and lower levels of LPA2R in kidney tissue. The final effect of these two events is reduced kidney injury, which may be related to decreased inflammation.
Exogenous LPA provoked LPA2R downregulation. In cultured kidney proximal tubule cells, LPA stimulates the production and secretion of fibrogenic factors through a mechanism that transactivates TGF-β25. TGF-β transactivation by LPA is mediated by LPA2R signaling. The augmented TGF-β signaling and tubulointerstitial fibrosis that follows IRI is also accompanied by increased LPA2R and by enhancement of fibrinogenic factors25. Based on this observation, we proposed that LPA2R downregulation due to LPA exposure in the LPA-treated group mediates the prevention on tissue remodeling. Among all of the LPA receptors, the LPA2R is unique in the carboxyl-terminal tail, which contains two distinct protein–protein interaction domains. Prolonged LPA stimulation promotes the association of Siva-1 with the LPA2R, and targets both proteins for ubiquitination and degradation. This intracellular event attenuated the proapoptotic activity of LPA2R/Siva-145.
The rationale behind the study of TGF-β expression was the detection of kidney fibrosis in 24 h after I/R procedure, which seems to be precocious. TGF β is a key profibrotic growth factor that is activated in acute kidney injury by injured and inflamed tubular cells. If this event is not interrupted, injured proximal tubules may undergo de-differentiation, cell cycle arrest that leads to an acute deposition of fibronectin46, and finally apoptosis. These events are associated with the development of chronic kidney disease47. We observed fibronectin accumulation in the cortical interstitium and increases in tubular TGF-β expression in the I/R rats (Fig. 4 and Fig. 5, respectively). Our model is in accordance with observations mentioned above from the literature. LPA treatment hinders fibronectin accumulation and tubular TGF-β expression. This led us to propose that LPA impedes acute kidney injury progression to chronic kidney disease.
With respect to the immunoexpression of TGF-β in the glomeruli of the control rat, the antibody used to identify this protein does not differentiate between the latent and the active forms, it is possible that in the glomeruli of the control rats there is a high basal level of latent TGF-β. Similar data was previously reported28. This observation could be related to the regulation of the extracellular matrix mediated by mesangial cells, since these cells express and respond to TGF-β signaling48,49. Moreover, I/R augmented tubular TGF-β expression in patients with established structural kidney injury and increase in serum creatinine50,51. The downregulation of TGF-β1 and fibronectin led us to propose that LPA prevents the progression of acute kidney injury to chronic kidney disease.
The plasma LPA levels may vary in both acute or chronic kidney disease (CKD). In CKD, augmented plasma LPA levels are related to abnormal renal tubular epithelial cell architecture, recruitment of immune cells to the site of injury, and a profibrotic profile20,21. LPA-receptor antagonism presented beneficial results. Indeed, in the mouse model of diabetic nephropathy, LPA1R/ LPA3R antagonism attenuated the development of glomerular sclerosis and tubulointerstitial fibrosis22-24. Other studies showed similar or reduced LPA levels in the plasma, but an increased urinary LPA level in CKD patients and animal models52-54, suggesting that the physiological implications of plasma LPA downregulation during IRI are related to the silent progression to CKD. In mouse models of sepsis-induced AKI, it has been described that LPA plasma levels may be augmented55, or unchanged,27 and are associated with diminished LPA kidney levels. We showed that I/R-inducing AKI decreases LPA plasma levels, leading to the hypothesis that exogenous administration of LPA may be a potential pharmacological tool. Indeed, LPA treatment replenished both plasma (as shown here) and kidney LPA levels27. LPA replenishment mitigates several downstream effects that are characteristic of both I/R- and sepsis-induced AKI.
The relationship between structure and function in the kidney is reflected in the glomeruli: disrupted glomerular structure with increases in size of the Bowman’s space are associated with decreased GFR, a defining feature of AKI24,38,56,57. The administration of subcapsular LPA preserved the glomerular structure and function, similar to other studies which utilized intraperitoneal administration22,24. The unexpected data was observed in the tubulo-interstitial relationship. Although LPA treatment prevented disruption of tissue architecture and development of interstitial fibrosis, it did not result in an improvement of tubular function. The LPA treated rats still exhibited increased urine volume, proteinuria, and reduced FENa and urine osmolality. It is likely these alterations are consequences of a tubular mechanism not totally detected in the histological analysis, such as the intracellular signaling mediated by LPA and/or Na+ transport.
The renal mechanisms of Na+ transport are the main determinants of urinary Na+ excretion, constituting the primary active regulators of urinary composition and body homeostasis3,58. Because FENa is the percentage of the Na+ filtered by the kidney which is excreted in the urine, as tubular Na+ reabsorption increases, the lower the FENa percentage is. The relationship between (Na++K+)ATPase activity and FENa was demonstrated by the observation ouabain injection [the (Na++K+)ATPase inhibitor] augments natriuresis by suppression of sodium reabsorption (evaluated by FENa) in renal tubules. The basolateral transport of Na+ is one of the limiting steps in tubular Na+ reabsorption58. Two Na+ pumps have been described: the classic ouabain sensitive (Na++K+)ATPase and the ouabain-resistant, furosemide-sensitive Na+- ATPase58,59 We observed that the (Na++K+)ATPase had the highest level of protein content and enzyme activity, while Na+-ATPase activity was decreased after I/R. The increased level of (Na++K+)ATPase activity is in accordance with the observation that mRNA from (Na++K+)ATPase a1 subunit increases with 24h reperfusion in kidney cortexes60. Moreover, immunolocalization of the (Na++K+)ATPase revealed its localization at the apical side of the tubules as detected by others61. This indicates an initial loss of tubular cell polarity demonstrated by changes observed in the histological analysis.
Our data is in accordance to Kwon et al61 who showed that in post ischemic acute renal failure, the FENa was 40 ± 6% at day 0, and falls to 11 ± 5% on day 7, even in presence of tubular damage. This finding was associated to the mis-localization of the (Na++K+)ATPase exclusively in the proximal tubules, while mainly basolateral in distal straight and convoluted tubule segments and collecting ducts. We observed the same event reported in the renal cortex associated with augmented cortical (Na++K+)ATPase activity. Under this circumstance, as an adaptive mechanism, (Na++K+)ATPase activity may be enhanced to maintain Na+ reabsorption. However, the augmented enzyme activity is a maladaptation of the tissue remodeling. The presence of (Na++K+)ATPase in the luminal membrane of the tubules jeopardize the vectoral Na+ transport. The cortical proximal tubule is the segment responsible to 70% of Na+ and water reabsorption, thereby it is possible to correlate the decreases in FENa to the augmented cortical (Na++K+)ATPase. Our data indicate that LPA treatment preserved the sensitivity of (Na++K+)ATPase to the PLC/PKC pathway and its localization in the basolateral membrane as observed in CTRL. LPA2R downregulation, observed in the LPA treated group, may be involved in the normalization of the PLC/PKC pathway and sensitivity of (Na++K+)ATPase by this pathway (Figure 10). However, LPA did not protect the decrease in Na+-ATPase activity during I/R. We suggest that this lack of LPA response is critical for the impairment of the tubular function.
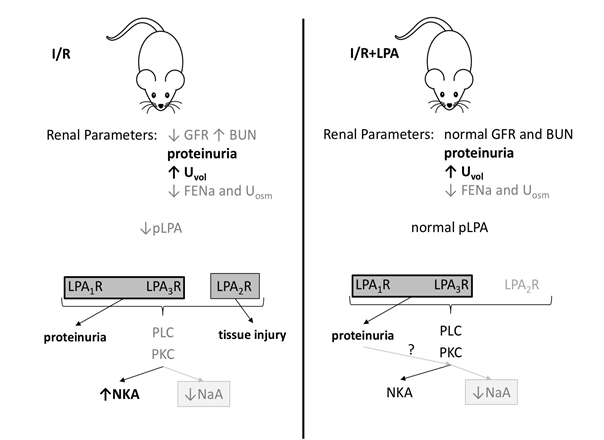
Figure 10: Proposed model for the underlying mechanism by which LPA treatment prevents IRI and protects glomerular function without alteration of proteinuria, urinary electrolyte, and water excretion. GFR: glomerular filtration rate, BUN: blood urea nitrogen, Uvol: urinary volume, FENa: fractional Na+ excretion, pLPA: plasma LPA levels, LPA1,2 or 3R: LPA1,2 or 3 receptors, PLC: phospholipase C, PKC: protein kinase C, NKA: (Na++K+)ATPase activity, NaA: Na+- ATPase activity.
In the rat subjected to the I/R procedure we observed low LPA plasma levels, diminished glomerular function, and increased urine volume which was associated with a decreased FENa, low urine osmolality, and proteinuria. Subcapsular LPA treatment replenished LPA plasma levels and exclusively preserved glomerular function. LPA treatment prevented tissue damage, downregulated the LPA2R, impeded the diminished PKC activity detected in the I/R group, and maintained (Na++K+)ATPase activity and its sensitivity to the PLC/PKC pathway. Because Na+-ATPase activity remained decreased during LPA treatment, the unbalance with (Na++K+)ATPase is maintained. Na+-ATPase activity was insensitive to the PLC/PKC pathway. We proposed that proteinuria sustained by LPA1R and LPA3R may contribute to the low Na+-ATPase activity, this is a key mechanism in the development of chronic kidney disease.
Ouabain-resistant, furosemide-sensitive Na+-ATPase is involved in fine tuning Na+ tubular reabsorption60. In addition to the biochemical differences from (Na++K+)ATPase, Na+-ATPase was purified and cloned (ATNA gene) from guinea pig intestinal cells and shown to be a unique entity59. Twenty-four hours after the I/R episode, Na+-ATPase activity was decreased and was insensitive to LPA treatment. Even though (Na++K+)ATPase activity is normalized, due to the lack of LPA effect on the Na+-ATPase activity, the FENa remained decreased.
We investigated the involvement of the PLC/PKC pathway because: (i) it is the main pathway associated to LPAR62 and (ii) the active Na+ transporters are regulated by phosphorylation mediated by PKC13,14,31,37. I/R episode provokes the downregulation of calphostin C-sensitive PKC activity, increases (Na++K+)ATPase activity and decreases Na+-ATPase activity. Under this condition, both enzymes were insensitive to the PLC inhibitor, U73122. This observation led us to conclude that in the I/R kidney, the PLC/PKC pathway is numb, in part, because of the low LPA plasma levels. LPA treatment replenished LPA plasma levels reactivating the PLC/PKC pathway and normalized (Na++K+)ATPase activity and sensitivity to this pathway (Fig. 10). The open question is why Na+-ATPase activity remained low?
Even though LPA treatment preserved PKC activity – indicating a full activation of the PLC/PKC pathway in the LPA treated group – Na+-ATPase activity did not respond to the PLC inhibition as observed for (Na1+K1)ATPase. In other words, we could not detect U73122-sensitive Na+-ATPase activity in both I/R and I/R+LPA, as we detected in CTRL. This insensibility may maintain inappropriately high net tubular active Na+-transport in the LPA treated group, which explains, in part, why FENa in not affected by LPA treatment. The inverse correlation of Na+ tubular transport activity and FENa was also demonstrated in nephrotic rats63,64. We cannot disregard that LPA-resistant proteinuria may be an additional event that contributes to the decreased Na+-ATPase activity. It has been demonstrated that albumin overload inhibits PKB/PKC pathway, which decreases Na+-ATPase65. In this case, it is tempting to speculate the involvement of different PKCs isoforms. Indeed, it has been demonstrated that proteinuria is induced by LPA1R and/or LPA3R23,25, that was not diminished by LPA treatment, which may be a potential adverse effect of the long-term treatment.
We conclude that during renal I/R, plasma LPA levels decrease, and both kidney structure and function are jeopardized. Thus, therapeutic strategies consisting in replenishing LPA plasma levels may help to prevent IRI. Subcapsular LPA treatment replenished LPA plasma levels and preserved kidney structure and glomerular function, the gold standard for assessing renal function, offering potential a pharmacological tool to treat IRI. These beneficial effects were associated with kidney LPA2R downregulation. However, one should consider the lack of LPA on preserving tubular function, in part, due to a persistent proteinuria and a diminished FENa. The relevance of this work is that although LPA treatment preserves kidney structure and glomerular function, LPA did not act on tubular function, which once neglected may be a trigger for the progression of chronic disease66.
Acknowledgements
We thank Fernanda Motta Ribeiro da Silva for her technical assistance and Dr. Jennifer Lowe for critical revision of the manuscript. This work was funded by: the Carlos Chagas Filho Rio de Janeiro State Research Foundation (FAPERJ) grant E-26/171.137/2006 and E-26/111.665/2008 (L.S.L.), Brazilian National Research Council grant 303135/2015-8 (L.S.L.), Science without Borders from CNPq-Brazil, Especial Visiting Professor 420584/2013-7 (L.S.L. and M.C.P.) and The National Institutes of Health-NIDDK (DK104375 grant) to M.C.P. M.E-L is a recipient of fellowships from CNPq (Productivity 1D) and Scientist of our State (FAPERJ); L.S.L is a recipient of fellowships from CNPq (Productivity 2); P.M. was a recipient of fellowships from CNPq (Doctoral fellowship); S.R.G. and A.L.C. was a recipient of fellowships from Coordination for the Improvement of Higher Education Personnel (CAPES; Doctoral and Master fellowship), M.A.R. is a recipient of fellowships from CAPES (Master fellowship) and A.C.C was a recipient of The Ramadhyani-Bourgeois, MD Student Endowed Fund Award.
Conflict of Interest
The authors declare that there are no conflicts of interests.
References
- Silver SA, Chertow GM. The economic consequences of acute kidney injury. Nephron. 2017; 137: 297–301.
- Hoste EAJ, Kellum JA, Selby NM, et al. Global epidemiology and outcomes of acute kidney injury. Nat Rev Nephrol. 2018; 14: 607–625.
- Makris K, Spanou L. Acute kidney injury: definition, pathophysiology and clinical phenotypes. The Clinical Bioch Rev. 2016; 37: 85–98.
- Silver SA, Cardinal H, Colwell K, et al. Acute Kidney Injury: preclinical innovations, challenges, and opportunities for translation. Can J Kidney Health Dis. 2015; 1: 2–30.
- Bonventre JV, Yang L. Cellular pathophysiology of ischemic acute kidney injury. J Clin Invest. 2011; 121: 4210–4221.
- Malek M, Nematbakhsh M. Renal ischemia/reperfusion injury; from pathophysiology to treatment. J Renal Inj Prev. 2015; 4: 20–27.
- Verdoorn KS, Lindoso RS, Lowe J, et al. Bone marrow mononuclear cells shift bioactive lipid pattern in injured kidney towards tissue repair in rats with unilateral ureteral obstruction. Nephrol Dial Transplant. 2010; 25: 3867–3874.
- Carlisle RE, Brimble E, Werner KE. 4-Phenylbutyrate Inhibits Tunicamycin-Induced Acute Kidney Injury via CHOP/GADD153 Repression. PLoS ONE. 2014; 9(1): e84663.
- Mangino MJ, Tian T, Ametani M, et al. Cytoskeletal involvement in hypothermic renal preservation injury. Transplantation. 2008; 85: 427–436.
- Kaushal GP, Shah SV. Challenges and advances in the 776 treatment of AKI. J Am Soc Nephrol. 2014; 25: 877–883.
- Guilherme A, Reis-Silva C, Moraes-Albuquerque JH, et al. Novel phosphorylated lipid counteracts activation of the renal plasma membrane (Ca2++Mg2+) ATPase by endogenous phosphatidilnositol-4- phosphate. Biosci Rep. 1998; 18: 79–89.
- Starling AP, East JM, Lee AG. Phosphatidylinositol-4-phosphate increases therate of dephosphorylation of the phosphorylated Ca2+ATPases. J Bio Chem. 1995; 270: 14467–70.
- De Souza AM, de Carvalho TL, Lara LS, et al. The stimulatory effect of angiotensin II on Na+-ATPase activity involves sequential activation of phospholipases and sustained PKC activity. Biochim Biophys Acta. 2010; 1798: 354–349.
- Cabral LM, Wengert M, Almeida FG, et al. Ceramide-activated protein kinase A and Czeta inhibit kidney proximal tubule cell Na+-ATPase. Arch Biochem Biophys. 2010; 498: 57–61.
- Cabral LM, Wengert M, da Ressurreição AA, et al. Ceramide is a potent activator of plasma membrane Ca2+-ATPase from kidney-proximal tubule cells with protein kinase a as an intermediate. J Bio Chem. 2007; 282: 24559–24606.
- Einicker-Lamas M, Wenceslau LD, Bernardo RR, et al. Sphingosine-1-phosphate formation activates phosphatidylinositol-4 kinase in basolateral membranes from kidney cells: crosstalk in cell signaling through sphingolipids and phospholipids. J Biochem. 2003; 134: 529–536.
- Parril AL. Lysophosphatidic acid receptor agonists 800 and antagonists (WO2010051053). Expert Opin Ther Pat. 2011; 21: 281–286.
- Okusa MD, Ye H, Huang L, et al. Selective blockade of lysophosphatidic acid LPA3 receptors reduces murine renal ischemia-reperfusion injury. Am J Physiol Renal Physiol. 2003; 285: F565–F574.
- Contos JJ, Chun J. The mouse lp(A3)/Edg7 lysophosphatidic acid receptor gene: genomic structure, chromosomal localization, and expression pattern. Gene. 2001; 267: 243–253.
- Park F, Miller DD. Role of lysophosphatidic acid and its receptors in the kidney. Physiol Genomics. 2017; 49: 659–666.
- Pradère JP, Gonzalez J, Klein J, et al. Lysophosphatidic acid and renal fibrosis. Biochim Biophys Acta. 2008; 1781: 582–587.
- Zhang MZ, Wang X, Yang H, et al. Lysophosphatidic Acid Receptor Antagonism Protects against Diabetic Nephropathy in a Type 2 Diabetic Model. J Am Soc Nephrol. 2017; 28: 3300–3311.
- Sakai N, Chun J, Duffield JS, et al. Lysophosphatidic acid signaling through its receptor initiates profibrotic epithelial cell fibroblast communication mediated by epithelial cell derived connective tissue growth factor. Kidney Int. 2017; 91: 628–641.
- Li HY, Oh YS, Choi JW, et al. Blocking lysophosphatidic acid receptor 1 signaling inhibits diabetic nephropathy in db/db mice. Kidney Int. 2017; 91: 1362–1373.
- Geng H, Lan R, Singha PK, et al. Lysophosphatidic Acid Increases Proximal Tubule Cell Secretion of Profibrotic Cytokines PDGF-B and CTGF through LPA2- and Gαq-Mediated Rho 824 and αv β6 Integrin- Dependent Activation of TGF-β. Am J Pathol. 2012; 181: 1236–1249.
- de Vries B, Matthijsen RA, van Bijnen AA, et al. Lysophosphatidic acid prevents renal ischemia-reperfusion injury by inhibition of apoptosis and complement activation. Am J Pathol. 2003; 163: 47–56.
- Mirzoyan K, Denis C, Casemayou A, et al. Lysophosphatidic Acid Protects Against Endotoxin-Induced Acute Kidney Injury. Inflammation. 2017; 40: 1707–1716.
- Cortes AL, Gonsalez SR, Silva RCD, et al. Protective outcomes of low dose doxycycline on renal function of Wistar rats subjected to acute ischemia/reperfusion injury. Biochim Biophys Acta Mol Basis Dis. 2017; 1864: 102–114.
- Queiroz-Madeira EP, Lara LS, Wengert M, et al. Na+-ATPase in spontaneous hypertensive rats: possible AT(1) receptor target in the development of hypertension. Biochim. Biophys. Acta. 2010; 1798, 360–366.
- Lowry OH, Rosebrough NJ, Farr AL. Protein measurement with the Folin phenol reagent. J Biol Chem. 1951; 193: 265–275.
- Cabral LM, Wengert M, Almeida FG, et al. Ceramide-activated protein kinases A and C zeta inhibit kidney proximal tubule cell Na+-ATPase. Arch Biochem Biophys. 2010; 498: 57–61.
- Beiral HJ, Rodrigues-Ferreira C, Fernandes AM, et al. The impact of stem cells on electron fluxes, proton translocation, and ATP synthesis in kidney mitochondria after ischemia/reperfusion. Cell Transplant. 2014; 23: 207–220.
- Chen J, Chen JK, Conway EM, et al. Survivin mediates 849 renal proximal tubule recovery from AKI. Am Soc Nephrol. 2013; 24: 2023–2033.
- Gonzalez AA, Lara LS, Luffman C, et al. Soluble form of the (pro)renin receptor is augmented in the collecting duct and urine of chronic angiotensin II-dependent hypertensive rats. Hypertension. 2011; 57: 859–864.
- Lara LS, McCormack M, Semprum-Prieto LC, et al. AT1 receptor mediated augmentation of angiotensinogen, oxidative stress, and inflammation in ANG II-salt hypertension. Am J Physiol Renal Physiol. 2012; 302: F85–F94.
- Kamejima S, Tatsumi N, Anraku A, et al. Gcm1 is involved in cell proliferation and fibrosis during kidney regeneration after ischemia reperfusion injury. Scientific Reports. 2019; 9: 7883.
- Caruso-Neves C, Malaquias AT, Lóss FF, et al. Bradykinin B1 receptor stimulates the proximal tubule Na(+)-ATPase activity through protein kinase C pathway. Regul Pept. 2003; 115: 195–201.
- Takeda R, Nishimatsu H, Suzuki E, et al. Ghrelin improves renal function in mice with ischemic acute renal failure. J Am Soc Nephrol. 2006; 17: 113–121.
- Ascon M, Ascon DB, Liu M, et al. Renal ischemia-reperfusion leads to long term infiltration of activated and effector-memory T lymphocytes. Kidney Int. 2009; 75: 526–535.
- Basile DP, Donohoe D, Roethe K. Renal ischemic injury results in permanent damage to peritubular capillaries and influences long-term function. Am J Physiol Renal Physiol. 2001; 281: F887–F899.
- Basile DP, Anderson MD, Sutton TA. Pathophysiology 874 of acute kidney injury. Compr Physiol. 2012; 2: 1303–1353.
- Holderied A, Anders HJ. Animal models of kidney inflammation in translational medicine. Drug Discov Today: Disease Models. 2014; 11: 19–27.
- Zager RA, Johnson AC, Andress D, et al. Progressive endothelin-1 geneactivation initiates chronic/end-stage renal disease following experimental ischemic/reperfusion injury. Kidney Int. 2013; 84: 703–712.
- Molinas SM, Trumper L, Serra E, et al. Evolution of renal function and Na+,K +-ATPase expression during ischaemia-reperfusion injury in rat kidney. Mol Cell Biochem. 2006; 287: 33–42.
- Lin FT, Lai YJ, Makarova N, et al. The lysophosphatidic acid 2 receptor mediates down-regulation of Siva-1 to promote cell survival. J Biol Chem. 2007; 282(52): 37759–69.
- Grgic I, Campanholle G, Bijol V, et al. Targeted proximal tubule injury triggers interstitial fibrosis and glomerulosclerosis. Kidney Int. 2012; 82(2): 172–83.
- Gewin LS. Transforming Growth Factor-β in the Acute Kidney Injury to Chronic Kidney Disease Transition. Nephron. 2019; 143(3): 154–157.
- Ando T, Okuda S, Tamaki K, et al. Localization of transforming growth factor-beta and latent transforming growth factor-beta binding protein in rat kidney. Kidney Int. 1995; 47(3): 733–9.
- Lee HS, Song CY. Differential role of mesangial cells and podocytes in TGF-beta-induced mesangial matrix synthesis in chronic glomerular disease. Histol Histopathol. 2009; 24(7): 901–8.
- Buron F, Hadj-Aissa A, Dubourg L, et al. Estimating glomerular filtration rate in kidney transplant recipients: performance over time of four creatinine-based formulas. Transplantation. 2011; 92(9): 1005–11.
- Racca MA, Novoa PA, Rodriquéz I, et al. Renal dysfunction and intragraft proMMP9 activity in renal transplant recipients with interstitial fibrosis and tubular atrophy. Transpl Int. 2015; 28(1): 71–8.
- Saulnier-Blache JS, Feigerlova E, Halimi JM, et al. Urinary lysophopholipids are increased in diabetic patients with nephropathy. J Diab Complications. 2017; 31: 1103–1108.
- Michalczyk A, DoÅÄgowska B, HeryÄ R, et al. Associations between plasma lysophospholipids concentrations, chronic kidney disease and the type of renal replacement therapy. Lipids Health Dis. 2019; 18(1): 85.
- Mirzoyan K, Baïotto A, Dupuy A, et al. Increased urinary lysophosphatidic acid in mouse with subtotal nephrectomy: potential involvement in chronic kidney diseas. J Physiol Biochem. 2016; 72: 803-812.
- Zhao J, HE D, Su Y, et al. Lysophosphatidic acid receptor 1 modulates lipopolysaccharide-induced inflammation in alveolar epithelial cells and murine lungs. Am J Physiol Lung Cell Mol Physiol. 2011; 301: L547–L556.
- Horbelt M, Lee S, Mang HE, et al. Acute and chronic microvascular alterations in a mouse model of ischemic acute kidney injury. Am J Physiol Renal Physiol. 2007; 293: F688–F695.
- Li Volti G, Sorrenti S, Acquaviva R, et al. Effect of ischemia-reperfusion on renal expression and activity of N(G)-N(G)-dimethylarginine dimethylaminohydrolases. Anesthesiol. 2008; 109: 1054–1062.
- Feraille E, Doucet A. Sodium–potassium–adenosinetriphosphatase-dependent sodium transport in the kidney: hormonal control. Physiol. 2001; 81: 345–418.
- Rocafull MA, Thomas LE, del Castillo JR. The second sodium pump: from the function to the gene. Pflüg Arch. 2012; 463: 755–777.
- Caruso-Neves C, Coelho-Souza SA, Vives D, et al. Modulation of ouabain insensitive Na+-ATPase activity in the renal proximal tubule by Mg2+, MgATP and furosemide. Int J Biochem Cell Biol. 2002; 34: 1586–1593.
- Kwon O, Corrigan G, Myers BD, et al. Sodium reabsorption and distribution of Na+/K+-ATPase during postischemic injury to the renal allograft. Kidney Int. 1999; 55: 963–975.
- Yung YC, Stoddard NC, Chun J. LPA receptor signaling: pharmacology, physiology, and pathophysiology. J Lipid Res. 2014; 55: 1192–1214.
- Deschênes G, Doucet AJ. Collecting duct (Na+/K+)-ATPase activity is correlated with urinary sodium excretion in rat nephrotic syndromes. Am Soc Nephrol. 2000; 11: 604–615.
- Lu SG, Jiang XY, Hu MC, et al. Na(+)-K(+)-ATPase activity: role in the impaired sodium excretion of experimental nephrosis in rats. Chin Med J. 1994; 107: 536–540.
- Peruchetti DB, Freitas AC, Pereira VC, et al. PKB is a central molecule in the modulation of Na+-ATPase activity by albumin in renal proximal tubule cells. Arch Biochem Biophys. 2019; 674: 108115.
- Liu J, Kumar S, Dolzhenko E, et al. Molecular characterization of the transition from acute to chronic kidney injury following ischemia/reperfusion. JCI insight. 2017; 2(18): e94716.