
Modified Pooled Cohort Atherosclerotic Cardiovascular Disease Risk Prediction Equations in American Indians
Nawar M. Shara, PhD1,2,3*, Sameer Desale, MS1, Barbara V. Howard, PhD1,2,3, Zeid Diab1,4, Wm. James Howard, MD5, Lyle G. Best, MD6, Wenyu Wang, PhD7, Elisa T. Lee, PhD7, Richard B. Devereux, MD8, Xiyao Ai, MS9, Jason G. Umans, MD, PhD1,2,3
1 MedStar Health Research Institute, Hyattsville, MD, United States.
2 Georgetown-Howard Universities Center for Clinical and Translational Science, Washington, DC, United States.
3 Georgetown University, Washington, DC, United States.
4 Virginia Commonwealth University, Richmond, VA, United States.
5 MedStar Washington Hospital Center, Washington, DC, United States.
6 Missouri Breaks Industries Research Inc., Eagle Butte, SD, United States.
7 College of Public Health, University of Oklahoma, Oklahoma City, OK, United States.
8 Weill Cornell Medicine, New York, NY, United States.
9 American University, Washington, DC, United States.
Abstract
American Indians (AI) have a high prevalence of diabetes, obesity, cardiovascular disease (CVD), and chronic kidney disease. Inclusion of kidney function and other population-specific characteristics in equations used to predict atherosclerotic CVD (ASCVD) risk may help define risk more accurately in populations with these chronic diseases. We used data from the Strong Heart Study (SHS), a population-based longitudinal cohort study of AI, to modify the American College of Cardiology/American Heart Association (ACC/AHA) Pooled Cohort ASCVD risk equations and then explored the performance of the new equations in predicting ASCVD in AI. The study included baseline SHS exam data from 4213 individuals between 45 and 75 years of age, collected in 13 communities from 3 geographic areas in the United States and spanning a wide range of tribal backgrounds, with continuous follow-up data from 1989 to 2015. Using SHS data for blood pressure, diabetes, cholesterol, smoking, and renal function, Cox proportional hazard models were developed to predict ASCVD-free time for AI men and women. ASCVD risk in AI calculated using the SHS-modified equations were compared to risk calculated using the ACC/AHA pooled cohort equations for African Americans (AAs) and Whites. Goodness-of-fit measures for ASCVD risk prediction showed that the SHS-modified equations fit the data from the SHS better than the ACC/AHA equations for AAs and Whites. Adjusting risk prediction equations using population data from the SHS and including measures of renal function significantly improved ASCVD risk prediction in our AI cohort.
Introduction
Cardiovascular disease (CVD) is the leading cause of death in the United States, and healthcare costs associated with coronary heart disease (CHD) alone total $108.9 billion annually1. Guidelines from the American Heart Association recommend targeting preventive cardiovascular interventions to reduce the individual risk of CVD events. Calculations of CVD risk are traditionally based on factors such as cholesterol, age, smoking status, hypertension, and family history, with estimates of 10-year risk used to inform treatment decisions2. In 2013, the American College of Cardiology (ACC) and the American Heart Association (AHA) refined this approach by developing risk prediction equations based on pooled data from longitudinal population-based studies of African Americans (AAs) and non-Hispanic Whites enrolled in the Atherosclerotic Risk in Communities study, Cardiovascular Health Study, Coronary Artery Risk Development in Young Adults, and the original Framingham Heart Study (FHS) and its Offspring studies. These pooled data were used to estimate the 10-year risk of hard atherosclerotic cardiovascular disease (ASCVD) events, defined as nonfatal myocardial infarction (MI), coronary heart disease (CHD) death, or fatal or nonfatal stroke, with separate equations developed for women and men and for AAs and Whites. These equations can be used to quantify the 10-year risk of ASCVD events in asymptomatic individuals between 40 and 79 years of age, taking into account age, systolic blood pressure (SBP), antihypertensive therapy, diabetes, smoking status, and total and high-density lipoprotein cholesterol (HDL-C) levels3. The ACC/AHA guidelines recommend using these equations to inform discussions about initiating statin treatment for adults between 40 and 75 years of age without clinically evident ASCVD, with treatment recommended for those with a 10-year risk ≥7.5% and treatment considered for those whose risk is 5.0–7.5%3.
The ACC/AHA guidelines noted that individuals other than non-Hispanic Whites and AAs were underrepresented in the pooled cohort data used to develop the ASCVD risk equations, that ASCVD risk was higher in American Indians (AI), and that calibration factors to adjust 10-year ASCVD risk for other racial and ethnic groups (including AI) were lacking3. Specifically, the ACC/AHA equations were found to overestimate ASCVD risk when applied to data from the Multi-Ethnic Study of Atherosclerosis (MESA) and Reasons for Geographic and Racial Differences in Stroke studies3,4. Indeed, a recent analysis included data from MESA and from the Jackson Heart Study cohorts (of AAs) and removed those from the original Framingham to re-derive 10-year risk models5. The findings that suggested clinically important miscalibration were confirmed in three additional cohorts4. The impact of this miscalibration on clinical utility of the ACC/AHA equations remains unsettled and may be due to incomplete adjudication of incident events, inclusion of participants already using statins, or exclusion of important risk factors6. Other studies have also reported overestimation of risk with the ACC/AHA equations in US and European populations6-8. Likewise, compared with the European SCORE risk equation, the ACC/AHA equations overestimate indications for statin therapy9.
Although AI have higher rates of CHD, stroke, and heart failure than the general US population10,11, they are often underrepresented in US CVD data and were essentially absent from the cohorts used to develop the ACC/AHA equations. The Strong Heart Study (SHS) was initiated in 1989 as a longitudinal population-based cohort study to provide validated data on CVD and its risk factors in AI; continuous outcomes data have been collected for AI who were 45–74 years of age at baseline. The SHS remains the best source of long-term population-based data on CVD events in AI. The SHS cohort consists of AI from 13 communities in 3 geographic areas, spanning a wide range of tribal backgrounds. We previously developed CHD risk prediction equations for AI and compared them with equations derived from the Framingham Heart Study12,13, extending these results to CVD risk (including heart failure)14. That work established that the coefficients for low-density lipoprotein cholesterol (LDL-C) and BP differed in the SHS and Framingham cohorts, and that including either albuminuria or estimated glomerular filtration rate (eGFR) increased the predictive accuracy for CHD and CVD in AI12-15. In this report, we modified the existing ACC/AHA pooled cohort equations by adding variables significantly associated with CVD risk in the SHS population and then comparing the performance of the ACC/AHA equations in AAs and Whites3 and our SHS-modified equations in predicting ASCVD in AI.
Methods
Study cohort
The original SHS cohort included 4,549 AI men and women at the baseline examination (1989–1992), of whom 4213 were 45–75 years of age and had no history of MI, stroke, coronary revascularization, atrial fibrillation, or chronic heart failure; they were included in the current analysis. Participants were contacted yearly to assess outcomes. The SHS design, survey methods, and laboratory techniques were the same each year and staff were trained with a standardized protocol based on AHA/NHLBI guidelines and have been published previously10,14,15.
The Indian Health Service, institutional review boards, and participating tribes approved this study. All participants provided informed consent.
Overall study design
For our study cohort, participant information was examined over the entire 27-year follow-up of SHS to determine whether a hard ASCVD event had occurred. These data were used to adapt and test the ACC/AHA equations for ASCVD risk prediction in AI.
The ACC/AHA equations3 were first applied to determine the 10-year risk of a hard ASCVD event in our study cohort. We also determined the proportion of SHS participants who met criteria for “statin treatment not recommended,” “statin treatment considered,” or “statin treatment recommended,” according to the ACC/AHA equation 10-year risk thresholds of <5%, 5–7.5%, and ≥7.5%, respectively. The ACC/AHA equations were then re-estimated after modification based on the SHS data, and their fitness was re-evaluated. The new equations were developed from Cox models. Information from the 27-year follow-up was used to estimate effect sizes and baseline hazard function. Ten-year risk was calculated by using the baseline hazard at 10 years and applying the new SHS-modified risk equations. Bivariate analyses were performed on the study cohort stratified by sex to determine potentially important factors and covariates to include in the SHS equations. Data manipulation was performed in SAS 9.4 (Cary, NC), and the analysis was conducted in R 3.316. R packages used included survival, PBSmodelling, PredictABEL, ggplot2, boot, and doBy.
Variables
Variables consisted of participants’ demographic (age, sex) and clinical (LDL-C, HDL-C, triglyceride, diabetes, smoking status, eGFR, creatinine, albuminuria, urine creatinine, and BP/hypertension status) data. All variables were assessed using standardized methods and quality controls12-15.
All of methods used to measure the variables used in this study are listed in details on the SHS website found on (https://strongheart2.ouhsc.edu).
Outcome variables
Hard ASCVD was defined as first definite occurrence of nonfatal MI, CHD death, or fatal or nonfatal stroke3. MI, CHD death, fatal and nonfatal stroke were ascertained by continuous surveillance of the current cohort, using standardized criteria17. Models were evaluated with complete case analysis. Medical records were abstracted by trained field personnel. All events were adjudicated by trained physicians.
Vascular Risk Factors
Age, diabetes, hypertension, albuminuria, percentage of body fat, smoking, high concentrations of plasma insulin, and low concentrations of high-density lipoprotein cholesterol were all significant risk factors associated with high incidence of CHD in AI. We chose smoking because it is important in the equations used in other groups and providers will expect to see it. However, although smoking is common in AI, AI smoke sporadically and smoke far fewer cigarettes per day than do other ethnic groups. This suggests that, in most AI, the effect of smoking is overwhelmed by the effects of elevated LDL and BP. We observed this when developing our CHD prediction equation15,18-20.
General analysis plan
Several models were compared to evaluate ASCVD predictive performance in the SHS AI cohort. We compared the following ASCVD risk prediction equations in our analyses:
• ACC/AHA Pooled Cohort AA3.
• ACC/AHA Pooled Cohort White3.
• SHS AI (Equations developed in this study for AI men and AI women were based on the ACC/AHA equations and adapted for the AI population using SHS data with data-specific cut points.
Preliminary descriptive statistics for the participants were summarized and stratified according to sex and ASCVD status from baseline to the end of 2015. Chi-square and Fisher’s exact tests were used to compare categorical risk factors. An independent t-test was used to compare continuous risk factors in those who developed ASCVD and those who did not. The ACC/AHA equations were applied to the SHS data, providing each patient with two risk probabilities, one according to the equation for AAs and one according to the equation for Whites; these risks were used as fitted values for the area under the curve (AUC). To develop the AI-specific equation, the ACC/AHA model that showed more discrimination when applied to the SHS dataset was used as the starting point, and renal variables were added and compared by significance and improved concordance. After selection of the best renal variable, variables relating to BP and blood glucose were adjusted to minimize information loss as measured by Bayesian information criteria (BIC).
The ACC/AHA equations use the following formula to calculate risk (probability) of developing a hard ASCVD event in 10 years.
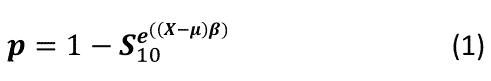
In equation (1), S10 is the underlying 10-year probability of ASCVD evaluated at μ, β is the vector of coefficients, X is the observed risk factor information, μ is the vector of mean values for the risk factors, and p is the predicted probability of a hard ASCVD event in the next 10 years. The ACC/AHA equations, therefore, use centered variables to compute the risk, and they exclusively use log transformations on all continuous variables.
The SHS risk equations developed in this study do not use centered variables. The predicted probability for developing a hard ASCVD event in 10 years is as follows:

In equation (2), βX is the linear equation given by various coefficients. Estimated Cox regression equations were fit on the SHS data and stratified by sex.
After participant information is added into equation (2) and the linear function is computed, the underlying 10-year probability of ASCVD is raised to the power of e raised to the power of the output of the linear function. After subtracting the survival rate from 1, equation (2) yields the predicted probability of ASCVD in the next 10 years.
Measures to assess model fit
To assess the ability of the ACC/AHA equations and the new SHS-modified equations to discriminate between participants who developed ASCVD and those who did not, Harrell’s C-statistic was used21. C-statistics ≥0.70 indicate good discrimination. The SHS equations were calibrated using the Hosmer-Lemeshow (HL) statistic22 to quantify how close the observed and predicted ASCVD events were during an average 10-year follow-up. An HL statistic of <20 indicates good calibration.
The SHS-modified equations were internally validated using bootstrapping methods23. We compared the classification power of the SHS-modified equations versus the ACC/AHA equations using the net reclassification index (NRI) and the integrated discrimination index (IDI)24,25.
Model validation
We assessed the validity of the SHS-modified equations to ensure reproducibility and consistency of the results using bootstrap sampling and global AUC using Harrell’s C-statistic21. We then compared the discriminatory power of the validated SHS-modified equations versus the ACC/AHA equations.
Results
ACC/AHA risk equations consistently overestimate the risk of ASCVD events among the SHS cohort
Of the 4213 SHS participants included in our cohort, 1149 (27.3%) had a hard ASCVD incident during the follow-up period (maximum 26.6 years, median 24 years). The observed rate of ASCVD events was higher among men (30.4%) than women (25.2%; p=0.0002). There were no missing outcomes data for the study cohort.
The baseline characteristics of participants with and without ASCVD are presented in Table 1. Both men and women with ASCVD had higher age, total cholesterol, LDL-C, SBP, and urine albumin-to-creatinine ratio (UACR); lower HDL-C and eGFR; and higher rates of diabetes, microalbuminuria, and macroalbuminuria compared to those without ASCVD (Table 1). Figure 1 shows the predictive performance of the ACC/AHA pooled cohort equations for Whites and AAs and the SHS-modified equation for calculating the risk of an ASCVD event in AIs. The two ACC/AHA risk equations consistently overestimate the risk of ASCVD events among the SHS cohort, for each risk category and for men and women.
Table 1: Baseline Characteristics of the Study Cohort, by Gender and ASCVD Status, SHS Baseline to End of 2015 (N=4213)
|
Women |
N |
No ASCVD |
ASCVD |
P value |
|
Age (years) |
2532 |
55.9 + 7.8 |
58.1 + 8.2 |
<0.001 |
|
BMI (kg/m2) |
2524 |
31.6 + 6.7 |
31.7 + 6.1 |
0.880 |
|
TC (mg/dL) |
2488 |
190.0 + 38.8 |
199.0 + 39.9 |
<0.001 |
|
HDL-C (mg/dL) |
2482 |
48.7 + 13.3 |
45.8 + 11.7 |
<0.001 |
|
LDL-C (mg/dL) |
2474 |
105.0 + 31.0 |
110.0 + 31.6 |
<0.001 |
|
SBP (mmHg) |
2522 |
125.0 + 18.6 |
133.0 + 22.9 |
<0.001 |
|
DBP (mmHg) |
2520 |
75.1 + 9.7 |
76.0 + 9.7 |
0.0520 |
|
UACR |
2475 |
10.3 (5.2-32.3) |
20.0 (7.6-161.0) * |
<0.001** |
|
Diabetes |
2532 |
510 (26.9%) |
304 (47.6%) |
<0.001 |
|
Albuminuria |
|
|
|
|
|
Normal |
2475 |
1375 (74.0%) |
354 (57.5%) |
<0.001 |
|
Micro |
337 (18.1%) |
142 (23.1%) |
||
|
Macro |
147 (7.9%) |
120 (19.5%) |
||
|
HTN Tx |
2532 |
305 (22.8%) |
171 (33.1%) |
<0.001 |
|
Smoking |
2529 |
558 (29.5%) |
213 (33.4%) |
0.0686 |
|
eGFRMDRD |
2442 |
74.5 + 20.6 |
72.7 + 27.5 |
<0.001 |
|
Men |
N |
No ASCVD |
ASCVD |
P value |
|
Age (years) |
1681 |
55.0 + 7.8 |
57.1 + 7.8 |
<0.001 |
|
BMI (kg/m2) |
1672 |
29.8 + 6.1 |
30.0 + 5.1 |
0.4394 |
|
TC (mg/dL) |
1660 |
187.0 + 42.3 |
197.0 + 40.0 |
<0.001 |
|
HDL-C (mg/dL) |
1663 |
43.8 + 13.9 |
42.2 + 13.8
|
0.0295 |
|
LDL-C (mg/dL) |
1657 |
107.0 + 32.8 |
113.0 + 32.9 2 |
<0.001 |
|
SBP (mmHg) |
1672 |
127.0 + 18.3 |
130 + 18.0 |
0.0057 |
|
DBP (mmHg) |
1672 |
78.8 + 10.3 |
79.8 + 10.1 |
0.0659 |
|
UACR |
1642 |
8.0 (3.5-29.1) |
12.5 (3.8-53.5) |
<0.001 |
|
Diabetes |
1681 |
248 (21.2%) |
166 (32.5%) |
<0.001 |
|
Albuminuria |
|
|
|
|
|
Normal |
1642 |
861 (75.5%) |
340 (67.9%) |
0.0012 |
|
Micro |
193 (16.9%) |
98 (19.6%) |
||
|
Macro |
87 (7.6%) |
63 (12.6%) |
||
|
HTN Tx |
1681 |
202 (17.3%) |
132 (25.8%) |
<0.001 |
|
Smoking |
1678 |
459 (39.3%) |
220 (43.1%) |
0.1691 |
|
eGFRMDRD |
1635 |
84.5 + 19.7 |
80.8 + 18.9 |
<0.001 |
Abbreviations: ASCVD=atherosclerotic cardiovascular disease; BMI=body mass index; DBP=diastolic blood pressure; eGFRMDRD=estimated glomerular filtration rate as calculated by the abbreviated Modification of Diet in Renal Disease (MDRD) equation; HDL-C=high-density lipoprotein cholesterol; HTN Tx=treated hypertension; LDL-C=low-density lipoprotein cholesterol; SBP=systolic blood pressure; SHS=Strong Heart Study; TC=total cholesterol; UACR=urine albumin-to-creatinine ratio.
* Student’s t tests were used for continuous variables; chi-square tests were used for categorical variables.
**Median (25th – 75th percentiles), p value was calculated using Wilcoxon test.
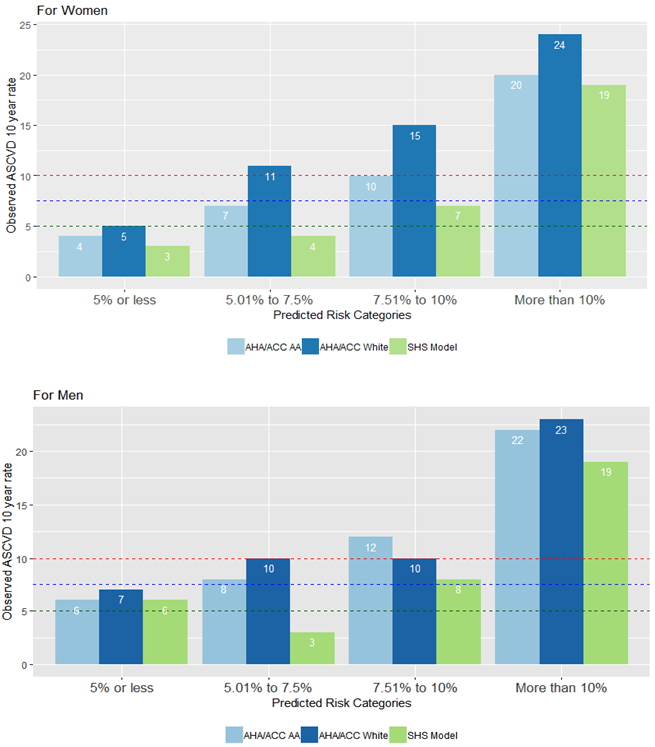
Figure 1: Predictive performance of the ACC/AHA pooled cohort equations for Whites and AAs and the SHS-modified equation for calculating the risk of an ASCVD event in AIs.
Cox proportional hazard models based on the variables used in the ACC/AHA equations for Whites and AAs were used to evaluate the performance of these risk equations in the SHS study cohort, separately for men and women. Several variables and interaction terms used in the ACC/AHA equations were not significant when these models were applied to the SHS cohort data (Table 2). Based on findings from these models and the comparison of baseline characteristics of the SHS cohort (Table 1), new Cox proportional hazard models were constructed for men and for women.
Table 2: Cox Proportional Hazards Model for ASCVD-Free Time from SHS Baseline
|
Women |
ACC/AHA - White |
ACC/AHA - AA |
SHS - AI model |
|||
|
No. of ASCVD events / N* |
620 / 2466 |
620 / 2466 |
594 / 2387 |
|||
|
|
Coefficient |
P value |
Coefficient |
P value |
Coefficient |
P value |
|
Ln Age (years) |
-35.609 |
0.0617 |
11.685 |
0.2754 |
-37.244 |
0.0344 |
|
Ln Age, Squared |
5.036 |
0.0195 |
- |
|
4.899 |
0.0241 |
|
Ln TC (mg/dL) |
2.645 |
0.6538 |
0.775 |
0.0002 |
- |
- |
|
Ln Age × Ln TC |
-0.455 |
0.7543 |
- |
|
- |
- |
|
Ln LDL-C (mg/dL) |
- |
- |
- |
|
0.430 |
0.0016 |
|
Ln HDL-C (mg/dL) |
0.186 |
0.9699 |
0.267 |
0.9586 |
-0.566 |
0.0011 |
|
Ln Age × Ln HDL-C |
-0.182 |
0.8813 |
-0.201 |
0.8737 |
- |
- |
|
Ln Treated SBP (mmHg) |
1.805 |
<.0001 |
9.169 |
0.2709 |
1.247 |
<0.001 |
|
Ln Age × Ln Treated SBP |
- |
- |
-1.806 |
0.3773 |
- |
- |
|
Ln Untreated SBP (mmHg) |
1.773 |
<.0001 |
8.921 |
0.2924 |
1.219 |
<0.001 |
|
Ln Age × Ln Untreated SBP |
- |
- |
-1.752 |
0.3997 |
- |
- |
|
Current Smoker (1=Yes, 0=No) |
-1.861 |
0.4586 |
0.529 |
<.0001 |
0.620 |
<.0001 |
|
Ln Age × Current Smoker |
0.592 |
0.3406 |
- |
- |
- |
- |
|
Diabetes (1=Yes, 0=No) |
0.952 |
<.0001 |
0.934 |
<.0001 |
0.644 |
<.0001 |
|
Ln UACR |
- |
- |
- |
- |
0.184 |
<.0001 |
|
eGFRMDRD |
- |
- |
- |
- |
0.006 |
0.0189 |
|
Ln eGFRMDRD |
- |
- |
- |
- |
-0.538 |
0.0061 |
|
C-statistic |
0.710 (0.690-0.729) |
0.710 (0.690-0.730) |
0.728 (0.707-0.749) |
|||
|
Bootstrap C-statistic |
0.712 |
0.712 |
0.730 |
|||
|
S10 |
0.9026 |
0.9025 |
0.9074 |
|||
|
Men |
ACC/AHA - White |
ACC/AHA - AA |
SHS - AI model |
|||
|
No. of ASCVD events / N* |
504 / 1649 |
504 / 1649 |
487 / 1593 |
|||
|
|
Coefficient |
P value |
Coefficient |
P value |
Coefficient |
P value |
|
Ln Age (years) |
4.131 |
0.6672 |
3.007 |
<.0001 |
3.514 |
<.0001 |
|
Ln TC (mg/dL) |
2.283 |
0.7356 |
1.029 |
<.0001 |
0.672 |
0.0166 |
|
Ln Age × Ln TC |
-0.312 |
0.8526 |
- |
- |
- |
- |
|
Ln LDL-C (mg/dL) |
- |
- |
- |
- |
0.481 |
0.0080 |
|
Ln HDL-C (mg/dL) |
-0.822 |
0.8665 |
-0.300 |
0.0661 |
-0.269 |
0.1325 |
|
Ln Age × Ln HDL-C |
0.130 |
0.9147 |
- |
- |
- |
- |
|
Ln Treated SBP (mmHg) |
0.882 |
0.0119 |
0.879 |
0.0121 |
0.478 |
0.1904 |
|
Ln Untreated SBP (mmHg) |
0.845 |
0.0174 |
0.842 |
0.0176 |
0.446 |
0.2262 |
|
Current Smoker (1=Yes, 0=No) |
0.064 |
0.9816 |
0.438 |
<.0001 |
0.482 |
<.0001 |
|
Ln Age × Current Smoker |
0.093 |
0.8924 |
- |
- |
- |
- |
|
Diabetes (1=Yes, 0=No) |
0.683 |
<.0001 |
0.638 |
<.0001 |
9.046 |
0.0019 |
|
Ln UACR |
- |
- |
- |
- |
0.125 |
<.0001 |
|
Ln eGFRMDRD |
- |
- |
- |
- |
-0.008 |
0.0023 |
|
Ln Age × Diabetes |
- |
- |
- |
- |
-2.118 |
0.0033 |
|
C-statistic, 95% CI |
0.675 (0.651-0.700) |
0.675 (0.651-0.700) |
0.695 (0.672-0.719) |
|||
|
Bootstrap C-statistic |
0.679 |
0.677 |
0.699 |
|||
|
S10 |
0.8305 |
0.8304 |
0.8370 |
|||
Abbreviations: AA=African American; ACC/AHA=American College of Cardiology/American Heart Association; AI=American Indian; ASCVD=atherosclerotic cardiovascular disease; eGFRMDRD=estimated glomerular filtration rate as calculated by the abbreviated Modification of Diet in Renal Disease (MDRD) equation; HDL-C=high-density lipoprotein cholesterol; LDL-C=low-density cholesterol; SBP=systolic blood pressure; SHS=Strong Heart Study; TC=total cholesterol; UACR=urine albumin-to-creatinine ratio.
In the SHS-modified equation for women,
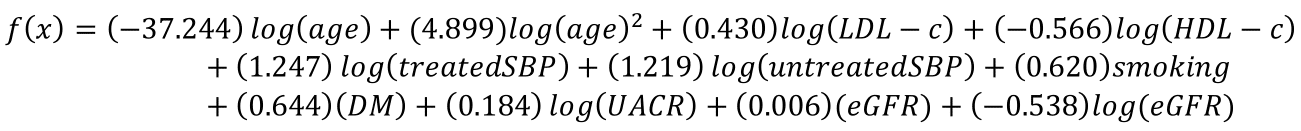
with a baseline 10-year survival of 0.91.
In the SHS-modified equation for men,
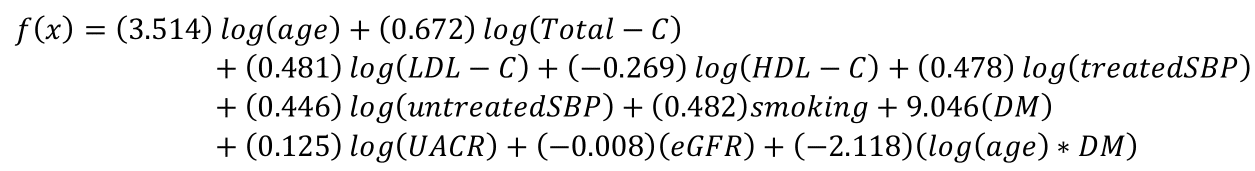
with a baseline 10-year survival of 0.84.
Using these equations, the probability of an ASCVD event within 10 years was estimated by calculating á¸(x) using the individual participant characteristics. Ten-year survival was estimated by raising the baseline 10-year hazard to the power of e to the power of the calculated á¸(x). Subtracting the estimated 10-year survival from 1 yielded the estimated 10-year hazard of an event.
Evaluation of equations for predicting the 10-year risk of an ASCVD event
For each participant, three 10-year risk probabilities were calculated by applying the original coefficients included in the ACC/AHA pooled cohort equations for Whites and AAs, and using coefficients from the new SHS-modified equations, according to the participant’s sex. Comparison of discrimination, calibration, and net reclassification of the three calculated risk probabilities are presented in Table 3. The SHS-modified equations performed better in predicting 10-year risk for AI (Table 3). Risk scores calculated using the SHS-modified equation for women also displayed much better calibration as assessed by the HL statistic (Table 3). Table 3 provides various measures to evaluate model improvement. The net reclassification index (NRI) is positive when the new model correctly reclassifies patients with ASCVD event into higher risk category and patients without ASCVD event into lower risk category and is negative for incorrect reclassifications. If the overall NRI is positive, then the new model has improved estimation. NRI can be calculated as a continuous measure to compare the overall performance between two models or as a categorical measure to compare the performance between two models at a selected cutoff point of a predicted probability. Integrated Discriminative Improvement (IDI) compares the difference in discrimination slopes (mean difference in probability between events and non-events). A positive IDI indicates that the difference between the predicted probability of patients with events and non-events is larger for the new model than the old model.
As Table 3 indicates, the SHS risk score for women has significantly higher continuous and categorical NRI (at cutoff point in risk=7.5%) when compared with the White risk score, and no significant difference when compared with AA risk score. Furthermore, IDI is significantly higher for the SHS risk score when compared with both White and AA risk scores. The SHS risk score also has a lower HL and higher C-statistic when compared with both White and AA risk scores.
The SHS score for men has significantly higher continuous NRI when compared with the AA risk score and no significant difference when compared with the White risk score. The categorical NRI for the SHS risk score at a cutoff point of 7.5% is significantly lower when compared with both AA and White risk scores. However, categorical NRI can vary based on the chosen cutoff point. For example, the categorical NRI is significantly higher if we choose a cutoff point of 15% instead of 7.5%. The IDI for the SHS score improved significantly when compared to both AA risk score and White risk score. The SHS score has a higher C-statistic than both White and AA risk scores. For men, all models had higher HL. Among them lowest HL was for AA risk score.
Table 3: Measures of Discrimination, Calibration, and Net Reclassification
|
|
ACC/AHA-White |
ACC/AHA-AA |
SHS AI |
ACC/AHA White vs. SHS AI |
ACC/AHA-AA vs. SHS AI |
|
10-year survival - Women |
|
|
|
|
|
|
C-statistic |
0.728 (0.699-0.758) |
0.742 (0.712-0.771) |
0.770 (0.740-0.799) |
- |
- |
|
HL statistic |
109 |
18.728 |
14.557 |
- |
- |
|
Continuous NRI |
- |
- |
- |
0.0255 (p=0.0165) |
-0.0096 (p=0.6880) |
|
Categorical NRI |
- |
- |
- |
0.0584 (p=0.007) |
-0.0511 (p=0.3966) |
|
IDI |
- |
- |
- |
0.0704 (p<.0001) |
0.027 (p<.0001) |
|
10-year survival - Men |
|
|
|
|
|
|
C-statistic |
0.686 (0.653-0.719) |
0.678 (0.645-0.710) |
0.714 (0.682-0.745) |
- |
- |
|
HL statistic |
39.42 |
22.62 |
37.19 |
- |
- |
|
Continuous NRI |
- |
- |
- |
-0.0081 (p=0.8337) |
0.0903 (p=0.0355) |
|
Categorical NRI |
|
|
|
-0.1015 (p=0.0001) |
-0.076 (p=0.0015) |
|
IDI |
- |
- |
- |
0.0386 (p<.0001) |
0.0451 (p<.0001) |
Abbreviations: AA=African American; ACC/AHA=American College of Cardiology/American Heart Association; AI=American Indian; HL=Hosmer-Lemeshow; IDI=integrated discrimination index; NRI=net reclassification index; SHS=Strong Heart Study.
Discussion
When the ACC/AHA pooled cohort equations for estimating ASCVD risk were published, it was emphasized that the equations might not be applicable to specific racial or ethnic groups because these groups were underrepresented in the cohorts used to develop the equations. To examine the performance of the equations in the AI population, we used data from the SHS, a longitudinal cohort study of CVD in AI. We found that the ACC/AHA equations consistently overestimated the 10-year risk of ASCVD in AI. We developed new equations based on CVD-associated variables in the SHS data and found that these SHS-modified equations offer superior risk prediction for AI compared to the ACC/AHA pooled cohort equations.
Our new SHS-modified equations differ in several respects from the ACC/AHA equations developed for Whites and AAs. For example, measures of renal damage or dysfunction were strong components of the SHS-modified risk equations for both sexes. Renal function has been shown in previous analyses of AI to be a predictor of CVD events13,26. Diabetes prevalence rates are high in both sexes in the AI population; approximately 50% of the SHS cohort had type 2 diabetes at baseline. Renal function often declines due to diabetic nephropathy prior to a diagnosis of diabetes, in the presence of prediabetes/impaired fasting glucose12,27. Further, the typical age of diabetes onset is lower in AI than in the general population28, the longer duration of exposure to prediabetes and diabetes increases the cumulative risk of diabetic nephropathy. In the SHS equation for women, renal function measured by eGFR as a continuous variable was a highly significant predictive factor; whereas for men, albuminuria was the stronger renal factor predictive of ASCVD events. Studies over the past two decades have highlighted the clinical heterogeneity of progressive chronic kidney disease (CKD) due to diabetic nephropathy, with some patients progressing from albuminuria to decreased renal function and others presenting with decreased eGFR in the absence of albuminuria29. The latter pattern, less commonly associated with retinopathy and diabetic microvascular disease30, appears to be increasing in prevalence31,32, especially among women33. Both patterns of nephropathy have been associated with CVD. We previously reported that including eGFR in risk equations improved CHD risk prediction in AI women, while including eGFR and albuminuria was superior in AI men13. This apparent sex difference in clinical presentation of diabetic nephropathy may have implications for CVD risk assessment and patient counseling in populations such as AI, with a high prevalence of diabetes and CKD.
AI have the highest rates of diabetes of all US ethnic groups, and diabetes has been shown to be a determinant of CVD in this population in multiple analyses12. Thus, we explored the presence of diabetes as well as level of diabetes control as measured by fasting plasma glucose (FPG) and the use of diabetes medications. The interaction between FPG and diabetes medication (hazard ratio of 1.08 for women and 1.1 for men) was significant for both sexes. This interaction is likely a surrogate for severity and duration of diabetes, explaining its impact on ASCVD development.
SBP was another important component of the SHS-modified equations for both sexes. Although severe hypertension is uncommon in this population, moderate hypertension is common and is related to obesity and diabetes. Again, given the early onset of obesity, insulin resistance, and their metabolic correlates in AI34, the risk of incident CVD may be magnified by the longer duration of these comorbid conditions in this population.
The ACC/AHA pooled cohort equations include various lipid and lipoprotein fractions that contribute to risk prediction, with the strongest factor being total cholesterol for women and LDL-C for men. Although average LDL-C is lower in AI than in other ethnic groups, the SHS data confirmed the expected graded positive association between LDL-C and CHD13. In contrast, HDL-C, which was inversely associated with obesity and diabetes and was low in both sexes of the SHS cohort, was a more significant variable in the SHS-modified equation for women but not for men.
Although smoking was included in the SHS-modified equations, its association with CVD was small. The effect of smoking on CHD and stroke risk has been previously shown to be small in the SHS population35, perhaps due to the low average number of cigarettes smoked per day compared with other US smokers, despite the high prevalence of current or ever smoking among the SHS participants32.
Goodness-of-fit and C-statistics indicated that the ACC/AHA pooled data equations fit the SHS data poorly (Table 3). The HL statistics ≥20 showed lack of fit, and the C-statistics indicated poor discriminatory power. When the SHS-modified equations were fit and evaluated on bootstrapped resamples, they showed improved goodness-of-fit, with higher C- and lower HL statistics.
This analysis has several strengths. The SHS dataset includes rigorously ascertained ASCVD events adjudicated using standardized ACC/AHA criteria3. Data on risk factors were collected using standardized methodology with rigorous quality control, thus ensuring comparability with other major CVD studies. While this study was limited to SHS participants 45–75 years of age, the long follow-up of the SHS cohort permitted analyses of 10-year risk in those >75 years of age. Data from a cohort of younger persons with 10-year outcomes will soon be available for further analysis. Our results may be applicable to other populations experiencing high rates of obesity and early-onset diabetes, characteristics which were nearly unique to AI 30 years ago; validation of the SHS-modified equations of ASCVD risk will be required in those populations. CVD is by far the largest cause of death in AI; thus, the identification and treatment of patients at risk is essential to reducing the event rate. Currently the majority of AI are seen by physicians in the Indian Health Service; thus, providing them with a simple tool (and our website will publish this as a user-friendly tool) should help to reduce the burden of CVD in these communities.
Conclusion
In conclusion, we developed and validated equations for predicting ASCVD risk in AI, based on data from the longitudinal SHS cohort study, as recommended by the authors of the ACC/AHA guidelines36,37. A clinical algorithm incorporating the SHS-modified equations will be made available on the internet for use by providers, thus enhancing efforts to prevent ASCVD events in this population.
Limitations
Although SHS includes 13 communities in 3 diverse geographic areas; it does not include members of the over 100 other American Indian communities in the US. Nevertheless, since SHS has collected the only standardized population-based data in 13 diverse American Indian communities, our equations should be more reliable than the equations derived from other ethnic groups.
Abbreviations
AA, African American; ACC, American College of Cardiology; AHA, American Heart Association; AI, American Indian; ASCVD, atherosclerotic cardiovascular disease; AUC, area under the curve; BIC, Bayesian information criteria; BMI, body mass index; BP, blood pressure; CHD, coronary heart disease; CKD, chronic kidney disease; CVD, cardiovascular disease; DBP, diastolic blood pressure; eGFR, estimated glomerular filtration rate; FPG, fasting plasma glucose; HDL-C, high-density lipoprotein cholesterol; HL, Hosmer-Lemeshow; HTN, hypertension; IDI, integrated discrimination index; LDL-C, low-density lipoprotein cholesterol; MDRD, Modification of Diet in Renal Disease; MI, myocardial infarction; NRI, net reclassification index; ROC, receiver-operator characteristic; SBP, systolic blood pressure; SHS, Strong Heart Study; TC, total cholesterol; UACR, urine albumin-to-creatinine ratio
References
- Heidenreich PA, Trogdon JG, Khavjou OA, et al. Forecasting the future of cardiovascular disease in the United States: a policy statement from the American Heart Association. Circulation. 2011; 123(8): 933-44. Epub 2011/01/26. doi: 10.1161/CIR.0b013e31820a55f5. PubMed PMID: 21262990.
- Expert Panel on Detection E, Treatment of High Blood Cholesterol in A. Executive Summary of The Third Report of The National Cholesterol Education Program (NCEP) Expert Panel on Detection, Evaluation, And Treatment of High Blood Cholesterol In Adults (Adult Treatment Panel III). JAMA. 2001; 285(19): 2486-97. Epub 2001/05/23. doi: 10.1001/jama.285.19.2486. PubMed PMID: 11368702.
- Goff DC Jr, Lloyd-Jones DM, Bennett G, et al. 2013 ACC/AHA guideline on the assessment of cardiovascular risk: a report of the American College of Cardiology/American Heart Association Task Force on Practice Guidelines. Circulation. 2014; 129(25 Suppl 2): S49-73. Epub 2013/11/14. doi: 10.1161/01.cir.0000437741.48606.98. PubMed PMID: 24222018.
- Ridker PM, Cook NR. Statins: new American guidelines for prevention of cardiovascular disease. Lancet. 2013; 382(9907): 1762-5. Epub 2013/11/26. doi: 10.1016/S0140-6736(13)62388-0. PubMed PMID: 24268611.
- Yadlowsky S, Hayward RA, Sussman JB, et al. Clinical Implications of Revised Pooled Cohort Equations for Estimating Atherosclerotic Cardiovascular Disease Risk. Ann Intern Med. 2018; 169(1): 20-9. Epub 2018/06/06. doi: 10.7326/M17-3011. PubMed PMID: 29868850.
- Muntner P, Colantonio LD, Cushman M, et al. Validation of the atherosclerotic cardiovascular disease Pooled Cohort risk equations. JAMA. 2014; 311(14): 1406-15. Epub 2014/04/01. doi: 10.1001/jama.2014.2630. PubMed PMID: 24682252; PubMed Central PMCID: PMCPMC4189930.
- Kavousi M, Leening MJ, Nanchen D, et al. Comparison of application of the ACC/AHA guidelines, Adult Treatment Panel III guidelines, and European Society of Cardiology guidelines for cardiovascular disease prevention in a European cohort. JAMA. 2014; 311(14): 1416-23. Epub 2014/04/01. doi: 10.1001/jama.2014.2632. PubMed PMID: 24681960.
- Santos M, Baptista R, Pego M. ACC/AHA 2013 and SCORE CV risk calculators: Are they the same in a low-risk southern European population? : American College of Cardiology. 2015. [cited 2019 September 9]. Available from: http://www.acc.org/latest-in-cardiology/articles/2015/03/02/11/01/acc-aha-2013-and-score-cv-risk-calculators?w.nav=Tl.
- Vaucher J, Marques-Vidal P, Preisig M, et al. Population and economic impact of the 2013 ACC/AHA guidelines compared with European guidelines to prevent cardiovascular disease. Eur Heart J. 2014; 35(15): 958-9. Epub 2014/02/27. doi: 10.1093/eurheartj/ehu064. PubMed PMID: 24569030.
- Howard BV, Lee ET, Cowan LD, et al. Rising tide of cardiovascular disease in American Indians. The Strong Heart Study. Circulation. 1999; 99(18): 2389-95. Epub 1999/05/11. doi: 10.1161/01.cir.99.18.2389. PubMed PMID: 10318659.
- Keenan NL, Shaw KM, Centers for Disease C, Prevention. Coronary heart disease and stroke deaths - United States, 2006. MMWR Suppl. 2011; 60(1): 62-6. Epub 2011/03/25. PubMed PMID: 21430624.
- Lee ET, Howard BV, Wang W, et al. Prediction of coronary heart disease in a population with high prevalence of diabetes and albuminuria: the Strong Heart Study. Circulation. 2006; 113(25): 2897-905. Epub 2006/06/14. doi: 10.1161/CIRCULATIONAHA.105.593178. PubMed PMID: 16769914.
- Shara NM, Wang H, Valaitis E, et al. Comparison of estimated glomerular filtration rates and albuminuria in predicting risk of coronary heart disease in a population with high prevalence of diabetes mellitus and renal disease. Am J Cardiol. 2011; 107(3): 399-405. Epub 2011/01/25. doi: 10.1016/j.amjcard.2010.09.036. PubMed PMID: 21257005; PubMed Central PMCID: PMCPMC3035999.
- Shara NM, Wang H, Mete M, et al. Estimated GFR and incident cardiovascular disease events in American Indians: the Strong Heart Study. Am J Kidney Dis. 2012; 60(5): 795-803. Epub 2012/07/31. doi: 10.1053/j.ajkd.2012.06.015. PubMed PMID: 22841159; PubMed Central PMCID: PMCPMC3473098.
- Howard BV, Lee ET, Cowan LD, et al. Coronary heart disease prevalence and its relation to risk factors in American Indians. The Strong Heart Study. Am J Epidemiol. 1995; 142(3): 254-68. Epub 1995/08/01. doi: 10.1093/oxfordjournals.aje.a117632. PubMed PMID: 7631630.
- Team RC. R: A language and environment for statistical computing Vienna, Austria: R Foundation for Statistical Computing. 2014. [cited 2019 September 9]. Available from: http://www.R-project.org/.
- Luepker RV, Apple FS, Christenson RH, et al. Case definitions for acute coronary heart disease in epidemiology and clinical research studies: a statement from the AHA Council on Epidemiology and Prevention; AHA Statistics Committee; World Heart Federation Council on Epidemiology and Prevention; the European Society of Cardiology Working Group on Epidemiology and Prevention; Centers for Disease Control and Prevention; and the National Heart, Lung, and Blood Institute. Circulation. 2003; 108(20): 2543-9. Epub 2003/11/12. doi: 10.1161/01.CIR.0000100560.46946.EA. PubMed PMID: 14610011.
- Deen JF, Adams AK, Fretts A, et al. Cardiovascular Disease in American Indian and Alaska Native Youth: Unique Risk Factors and Areas of Scholarly Need. J Am Heart Assoc. 2017; 6(10): e007576. Published 2017 Oct 24. doi:10.1161/JAHA.117.007576
- Zhang Y, Galloway JM, Welty TK, et al. Incidence and risk factors for stroke in American Indians: the Strong Heart Study. Circulation. 2008; 118(15): 1577-1584. doi:10.1161/CIRCULATIONAHA.108.772285
- Lee JS, Chang PY, Zhang Y, et al. Triglyceride and HDL-C Dyslipidemia and Risks of Coronary Heart Disease and Ischemic Stroke by Glycemic Dysregulation Status: The Strong Heart Study. Diabetes Care. 2017; 40(4): 529-537. doi:10.2337/dc16-1958
- Harrell JFE. Rms: Regression Modeling Strategies. R package version 4.2-1 [cited 2019 September 9]. Available from: http://CRAN.R-project.org/package=rms.
- Parzen M, Lipsitz SR. A global goodness-of-fit statistic for Cox regression models. Biometrics. 1999; 55(2): 580-4. Epub 2001/04/25. doi: 10.1111/j.0006-341x.1999.00580.x. PubMed PMID: 11318217.
- Bandos AI, Rockette HE, Gur D. Resampling methods for the area under the ROC curve: Universitat Politècnica de Valencia. 2006. [cited 2019 September 9]. Available from: https://pdfs.semanticscholar.org/ab67/08de70f90de28772313c0b2f9eb6d3b9747c.pdf.
- Van Calster B, Van Huffel S. Integrated discrimination improvement and probability-sensitive AUC variants. Stat Med. 2010; 29(2): 318-9. Epub 2009/12/23. doi: 10.1002/sim.3761. PubMed PMID: 20027623.
- Kerr KF, Wang Z, Janes H, et al. Net reclassification indices for evaluating risk prediction instruments: a critical review. Epidemiology. 2014; 25(1): 114-21. Epub 2013/11/19. doi: 10.1097/EDE.0000000000000018. PubMed PMID: 24240655; PubMed Central PMCID: PMCPMC3918180.
- Sarnak MJ, Levey AS, Schoolwerth AC, et al. Kidney disease as a risk factor for development of cardiovascular disease: a statement from the American Heart Association Councils on Kidney in Cardiovascular Disease, High Blood Pressure Research, Clinical Cardiology, and Epidemiology and Prevention. Circulation. 2003; 108(17): 2154-69. Epub 2003/10/29. doi: 10.1161/01.CIR.0000095676.90936.80. PubMed PMID: 14581387.
- Grundy SM, Benjamin IJ, Burke GL, et al. Diabetes and cardiovascular disease: a statement for healthcare professionals from the American Heart Association. Circulation. 1999; 100(10): 1134-46. Epub 1999/09/08. doi: 10.1161/01.cir.100.10.1134. PubMed PMID: 10477542.
- Buse JB, Polonsky KS, Burant CF. Type 2 diabetes mellitus. Williams Textbook of Endocrinology, 12th ed. Philadelphia, PA: Elsevier/Saunders. 2011; 1371-435.
- Onuigbo MA, Agbasi N. Diabetic Nephropathy and CKD-Analysis of Individual Patient Serum Creatinine Trajectories: A Forgotten Diagnostic Methodology for Diabetic CKD Prognostication and Prediction. J Clin Med. 2015; 4(7): 1348-68. Epub 2015/08/05. doi: 10.3390/jcm4071348. PubMed PMID: 26239680; PubMed Central PMCID: PMCPMC4519794.
- Kramer HJ, Nguyen QD, Curhan G, et al. Renal insufficiency in the absence of albuminuria and retinopathy among adults with type 2 diabetes mellitus. JAMA. 2003; 289(24): 3273-7. Epub 2003/06/26. doi: 10.1001/jama.289.24.3273. PubMed PMID: 12824208.
- Thomas MC, Macisaac RJ, Jerums G, et al. Nonalbuminuric renal impairment in type 2 diabetic patients and in the general population (national evaluation of the frequency of renal impairment cO-existing with NIDDM [NEFRON] 11). Diabetes Care. 2009; 32(8): 1497-502. Epub 2009/05/28. doi: 10.2337/dc08-2186. PubMed PMID: 19470839; PubMed Central PMCID: PMCPMC2713618.
- Ninomiya T, Perkovic V, de Galan BE, et al. Albuminuria and kidney function independently predict cardiovascular and renal outcomes in diabetes. J Am Soc Nephrol. 2009; 20(8): 1813-21. Epub 2009/05/16. doi: 10.1681/ASN.2008121270. PubMed PMID: 19443635; PubMed Central PMCID: PMCPMC2723977.
- Penno G, Solini A, Bonora E, et al. Clinical significance of nonalbuminuric renal impairment in type 2 diabetes. J Hypertens. 2011; 29(9): 1802-9. Epub 2011/07/09. doi: 10.1097/HJH.0b013e3283495cd6. PubMed PMID: 21738053.
- Chinali M, de Simone G, Roman MJ, et al. Cardiac markers of pre-clinical disease in adolescents with the metabolic syndrome: the strong heart study. J Am Coll Cardiol. 2008; 52(11): 932-8. Epub 2008/09/06. doi: 10.1016/j.jacc.2008.04.013. PubMed PMID: 18772065; PubMed Central PMCID: PMCPMC2703730.
- Eichner JE, Wang W, Zhang Y, et al. Tobacco use and cardiovascular disease among American Indians: the strong heart study. International journal of environmental research and public health. 2010; 7(10): 3816-30. doi: 10.3390/ijerph7103816.
- Clark MA. Using the 2013 ACC/AHA cholesterol guideline in caring for people with diabetes: IHS Division of Diabetes Treatment and Prevention. 2014. [cited 2019 September 9]. Available from: https://www.ihs.gov/sites/diabetes/themes/responsive2017/display_objects/documents/training_seminars/Transcript_Lipids_508c.pdf.
- Clark MA. ACC/AHA dyslipidemia guideline review: IHS Primary Care Provider. 2014. [cited 2019 September 9]. Available from: https://www.ihs.gov/sites/provider/themes/responsive2017/display_objects/documents/2010_2019/PROV0214.pdf.